Bullish Meeting Lines
Updated Aug 26, 2026
- Signal
- Bullish Reversal
- Reliability
- Moderate
- Rarity
- Common
- Confirmation
- Recommended
- Trend Position
- Downtrend Bottom
- Best Timeframes
- Daily+
On this page
Bullish Meeting Lines is a two-candle reversal pattern that appears at the bottom of a downtrend. The first candle is a long bearish candle continuing the decline; the second candle opens with a gap down but rallies through the session to close at essentially the same price as the first candle's close. That matching close, reached from a much lower open, is what gives the pattern its name and its reversal significance.
Recognition Criteria
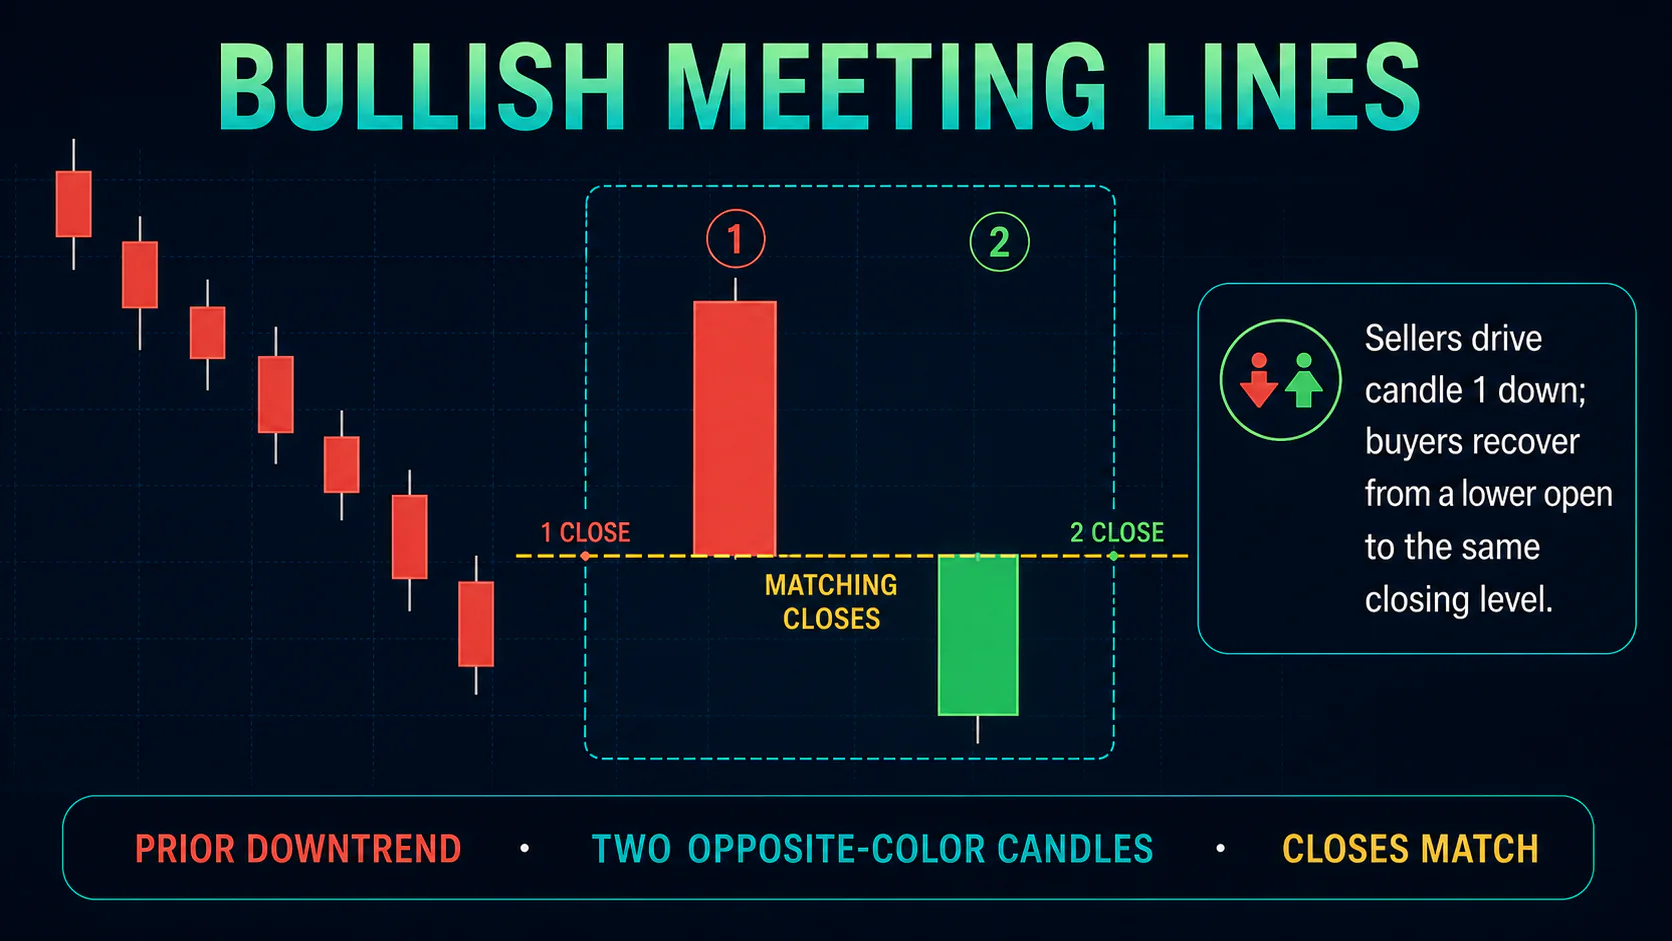
First candle: a long bearish candle that continues the existing downtrend with a substantial real body.
Second candle: a bullish candle that opens with a clear gap down from the first candle's close, then rallies during the session to close at essentially the same price as the first candle's close.
Matching closes: the defining feature of the pattern — the two candles' closing prices should be identical or nearly identical, despite the second candle opening well below that level.
Trend context: for the pattern to carry reversal significance, it should appear after a sustained downtrend rather than a shallow pullback.
Market Psychology
The first candle shows sellers firmly in control, pushing the close to a new low. The second candle opens even lower on the gap down, appearing to confirm continued weakness — but buyers step in during the session and drive price all the way back up to the previous close. Recovering an entire gap down to reach the same closing level shows that sellers could not extend their advantage, and that demand exists at that price. It's a single-session round trip that reverses the tone of the prior candle without technically closing higher than it.
Trading the Pattern
Entry
A common approach is to enter near the close of the second candle once the matching-close pattern is confirmed. More conservative traders wait for a third session to close above the meeting-lines level, or for a break above the pattern's high, before entering.
Stop Loss
Place stops below the low of the second candle, the gap low, since a break below that level would undo the recovery the pattern depends on. A stop below the low of the entire two-candle pattern is a more conservative alternative.
Targets
Favor nearby resistance levels over fixed percentage targets. The size of the gap that was recovered can serve as a rough measured-move estimate projected upward from the meeting-lines level; prior swing highs or resistance zones are usually more reliable guides.
Confirmation and Indicators
Volume on the second candle that exceeds recent averages adds weight to the idea that the recovery reflects genuine buying rather than a thin, low-liquidity bounce. Momentum indicators help filter setups: an oversold RSI reading heading into the pattern, or a bullish MACD crossover forming around the same time, both support the reversal case. A close above the pattern's high on the next session is the clearest follow-through confirmation.
Common Mistakes
Loose close-matching: accepting a "near enough" close that isn't actually close to the first candle's close weakens the signal the pattern is built on.
Ignoring the gap: without a genuine gap down on the second candle's open, there is no meaningful recovery story — the pattern needs the gap to make the matching close significant.
Trading it outside a real downtrend: the pattern needs a sustained prior decline to carry reversal weight; forming it in a sideways market adds little information.
Skipping volume and follow-through checks: a matching close on light volume, with no confirmation the next session, is a weaker version of the pattern and more prone to failure.
FAQs
How is this different from Bullish Separating Lines?
Bullish Separating Lines matches the two candles' opening prices and is a continuation pattern inside an uptrend. Meeting Lines matches the closing prices and is a reversal pattern at the bottom of a downtrend.
Does the gap down need to be large?
A more meaningful gap makes the recovery more significant, but there's no fixed threshold — judge it relative to the stock's normal daily range.
Do the closing prices need to be exact?
They should be very close. Small differences of a fraction of a percent are generally accepted as a match; a second candle that closes well above or below the first candle's close is no longer forming a meeting line.
Is confirmation necessary before trading it?
Given its moderate reliability, most traders wait for at least one confirming session — either a close above the pattern's high or continued volume support — before sizing into a position.
Can Meeting Lines appear in an uptrend?
The bearish version of the pattern, a bullish candle followed by a bearish candle sharing a close, can appear at the top of an uptrend as a bearish reversal signal, but that is a distinct pattern from the bullish version covered here.
Conclusion
Bullish Meeting Lines captures a specific kind of reversal: a gap down that the market fully erases within a single session, closing right back at the prior candle's level. That round trip shows sellers failed to build on their gap, making it a useful pattern to watch for at the end of an extended decline. As with any two-candle pattern, confirm with volume and a follow-through session rather than trading the setup in isolation.