Bullish Hammer
Updated Aug 26, 2026
- Signal
- Bullish Reversal
- Reliability
- Moderate
- Rarity
- Common
- Confirmation
- Recommended
- Trend Position
- Downtrend Bottom
- Best Timeframes
- Daily+
On this page
A bullish hammer is a single-candlestick reversal pattern that forms after a downtrend. It has a small real body positioned in the upper part of the session’s range, little or no upper shadow, and a lower shadow at least twice the length of the body — visual evidence that sellers pushed price sharply lower during the session before buyers regained control by the close.
Recognition Criteria
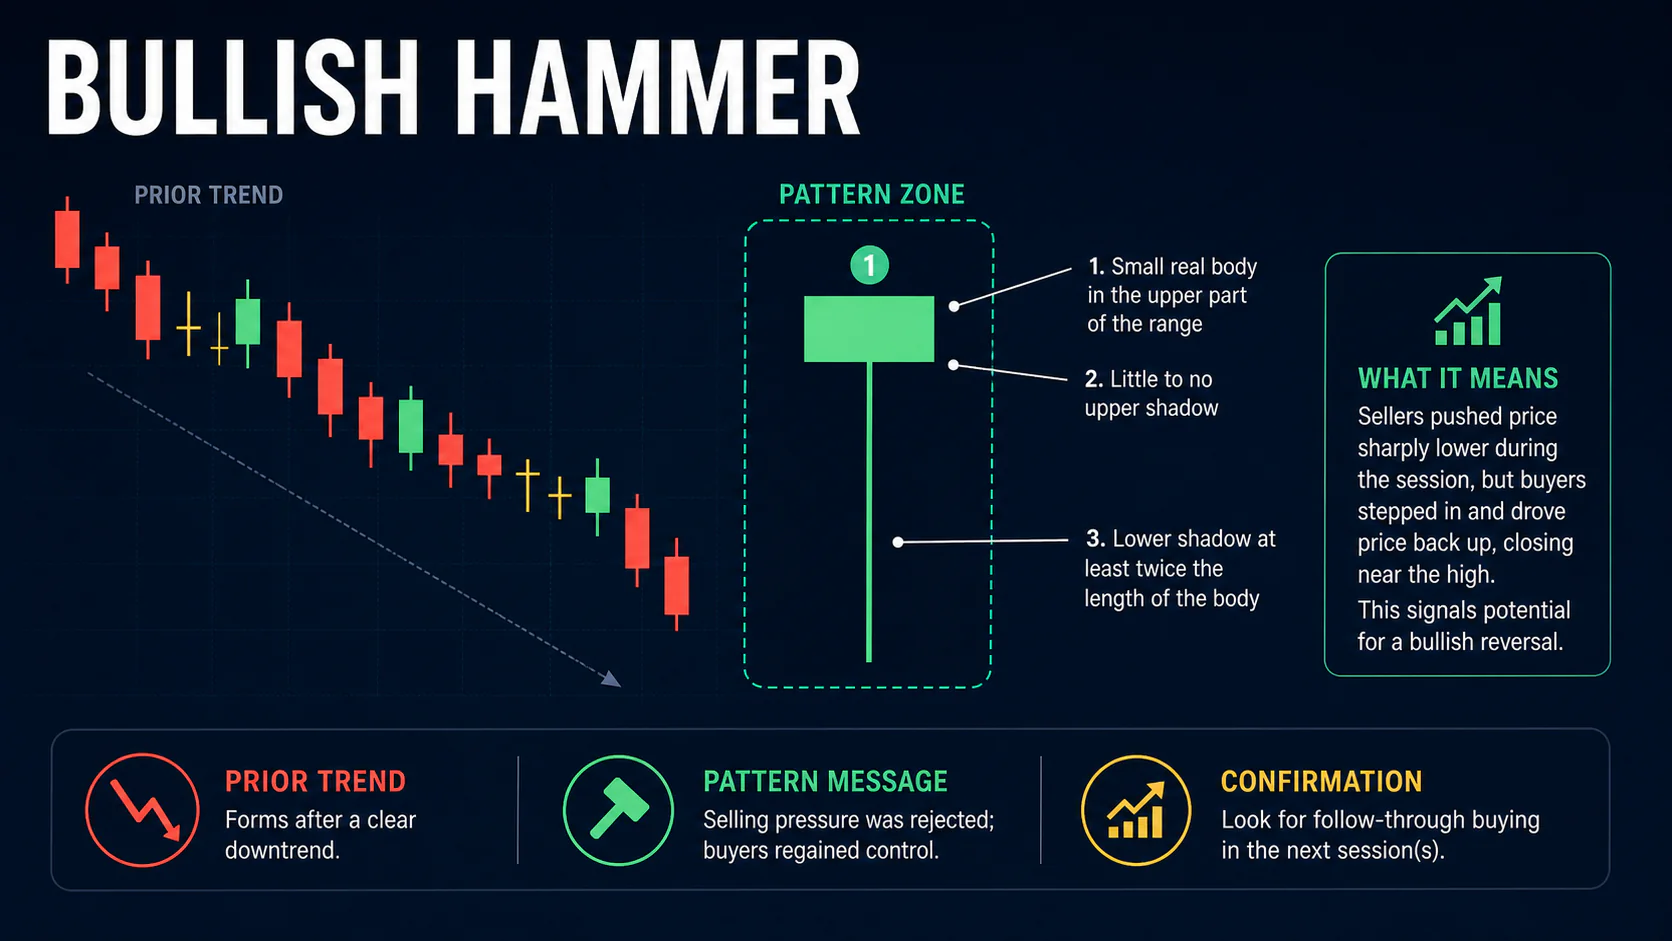
A valid hammer requires several elements to line up in the same session:
- A small real body, commonly less than a quarter to a third of the total range, positioned in the upper portion of that range
- A lower shadow at least twice the length of the real body — the defining feature of the pattern
- Little to no upper shadow
- Formation after a clear decline, not during an uptrend or a sideways range
Body color is secondary. Both a bullish-bodied hammer (close above open) and a bearish-bodied hammer (close below open) satisfy the definition, though the bullish-bodied version is generally viewed as the slightly stronger of the two since it shows buyers held the advantage through the close.
Market Psychology
The hammer captures a single session in which sellers initially press price to a new low, continuing the prevailing downtrend, then lose control as buyers step in and drive price back up near the open. The long lower shadow shows that lower prices were tested and rejected; the small body near the top of the range shows buyers held their ground into the close. Together, this suggests selling pressure may be nearing exhaustion and that demand is beginning to appear at lower levels — though a single candle is rarely proof of a durable shift, which is why confirmation matters.
Variations
A hammer with an unusually long lower shadow reflects a more decisive rejection of lower prices, though there is no fixed threshold that makes one hammer definitively stronger than another. A hammer that forms directly at a prior support level, a round number, or a major moving average carries more weight than one appearing in open space, simply because more market participants are watching that level. Volume that picks up during the session, particularly into the close, is a reasonable supporting signal but not a formal requirement of the pattern.
Trading the Hammer
Entry
Because a hammer only shows that sellers were rejected during one session, most traders wait for confirmation — a next-session close above the hammer’s high — before entering long. More aggressive traders may enter intraday when the hammer forms directly at a well-established support level, accepting the added risk of doing so without confirmation.
Stop-Loss
The hammer’s low is the natural invalidation point. A decisive move back below it undermines the idea that buyers defended that level, so stops are typically placed just below the hammer’s low, or below the nearest support level if that offers a better risk-to-reward setup.
Targets
The most realistic first target is nearby resistance — a prior swing high, a round number, or a moving average. Some traders project the length of the lower shadow upward from the hammer’s high as a rough minimum objective, though this is a guideline rather than a rule.
Confirmation
Confirmation typically means the following session closes above the hammer’s high, ideally on above-average volume. Waiting longer for confirmation reduces the odds of acting on a false signal but sacrifices some of the initial move — a trade-off every trader has to weigh for themselves.
Combining With Indicators
A hammer that forms while the RSI is below 30, or while stochastic readings sit in oversold territory, adds some weight to the idea that the prior decline was overextended. A bullish MACD crossover occurring around the same time can serve as an additional, independent piece of confirmation. None of these indicators change what the hammer itself represents — they simply provide context on whether a broader oversold condition supports a reversal.
Common Mistakes
- Labeling any small-bodied candle with a longer lower shadow as a hammer, without checking that the shadow is genuinely at least twice the body
- Ignoring trend context — the same shape appearing in an uptrend is a hanging man, a bearish signal, not a hammer
- Entering without any confirmation and without a plan for where the setup is wrong
- Placing stops so tight below the hammer’s low that ordinary volatility triggers an exit before the thesis has a chance to play out
FAQs
Is a bullish hammer always green?
No. What matters is the shape — a small body near the top of the range, minimal upper shadow, and a long lower shadow — not the color. A bullish-bodied hammer is generally viewed as somewhat more encouraging than a bearish-bodied one, but both are valid.
What’s the difference between a hammer and a hanging man?
They look identical. The distinction is entirely about trend context: the same shape is called a hammer after a downtrend (bullish implication) and a hanging man after an uptrend (bearish implication).
Do I need to wait for confirmation?
It isn’t mandatory, but it’s recommended. A hammer alone reflects a single session’s price action; a confirming close above the hammer’s high on the next session shows buyers followed through, meaningfully reducing the odds of acting on a false signal.
How is a hammer different from an inverted hammer?
A hammer has its long shadow on the bottom and a small body near the top of the range. A bullish inverted hammer is the mirror image — small body near the bottom, long upper shadow — and generally calls for stronger confirmation, since a close near the low is a less clear-cut show of strength.
Conclusion
The bullish hammer is one of the more recognizable single-candle reversal signals: a small body, little or no upper shadow, and a lower shadow at least twice the body’s length, forming after a decline. No candlestick pattern is reliable on its own, and the hammer is no exception — it works best alongside a genuine support level, a supportive oversold reading, and confirmation from the following session before committing capital.