Bullish Upside Tasuki Gap
Updated Sep 2, 2026 · Reviewed by Terence Scott, founder
- Signal
- Bullish Continuation
- Reliability
- Moderate
- Rarity
- Rare
- Confirmation
- Recommended
- Trend Position
- Established Uptrend
- Best Timeframes
- Daily+
On this page
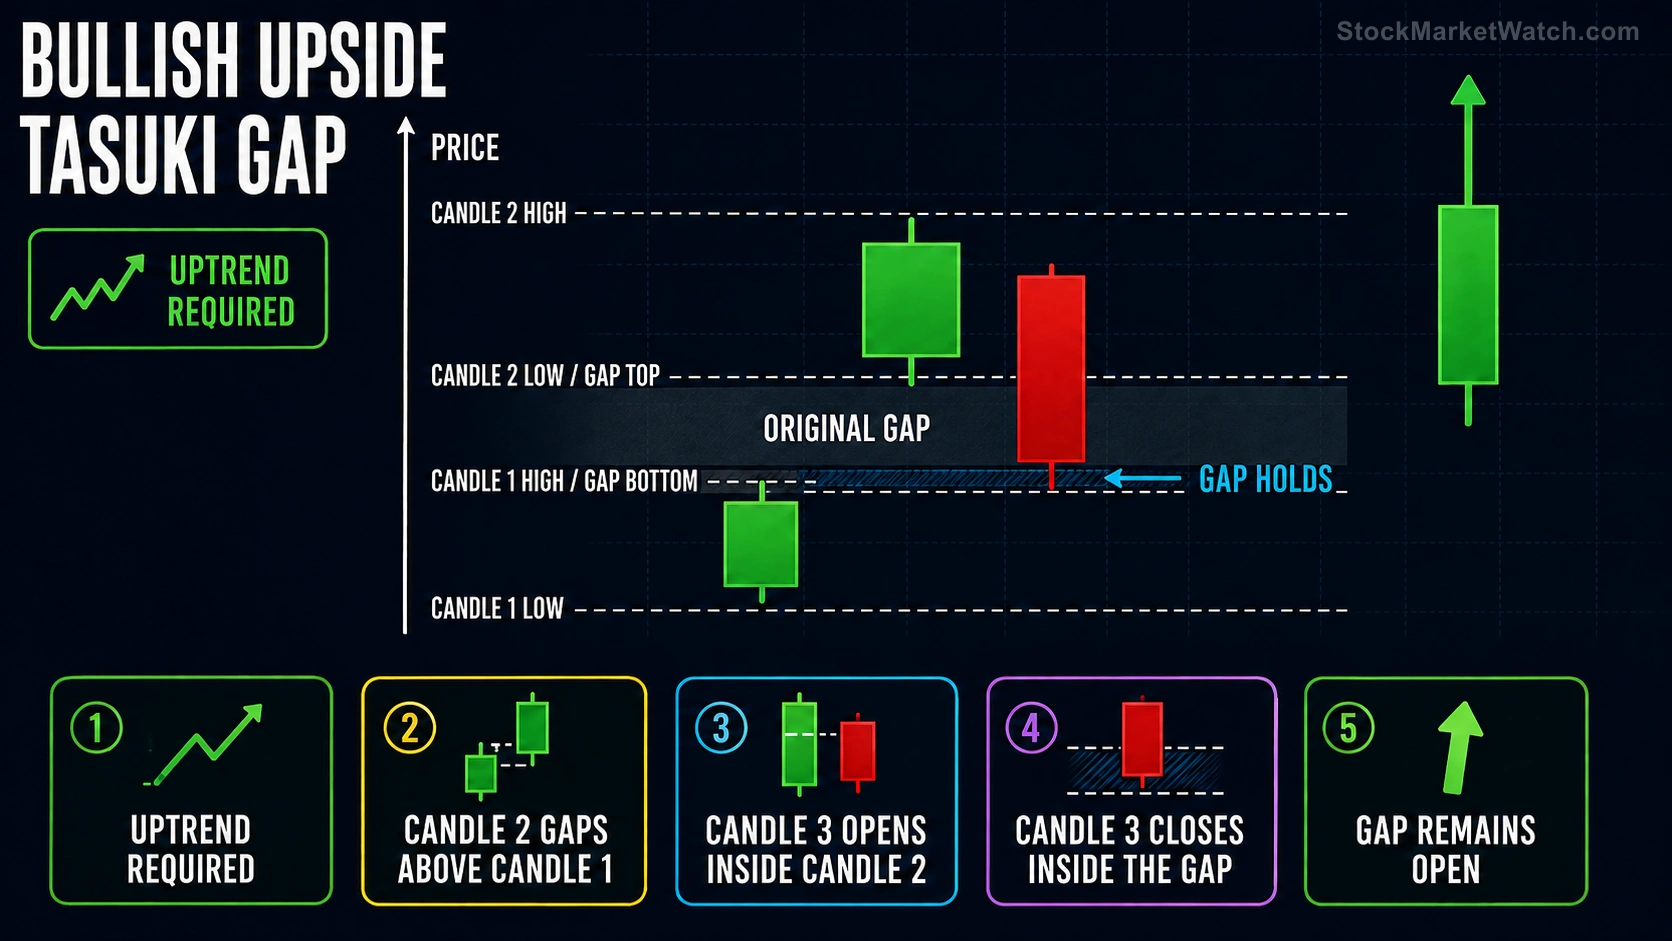
The bullish upside tasuki gap is a three-candle continuation pattern in an uptrend: a white candle, a second white candle that gaps up above it, and then a black candle that opens inside the second candle's body and sells off into the gap — but fails to close it. The gap holds as support, and the uptrend is judged ready to resume. "Tasuki" refers to a Japanese sash used to hold back a garment's sleeves — the black candle pulls back, but only so far.
Recognition Criteria
- An established uptrend is in place
- Candle 1: a bullish (white) candle continuing the trend
- Candle 2: a second white candle that gaps up — its body opens above candle 1's body, leaving open space on the chart
- Candle 3: a black candle that opens within candle 2's real body and closes down inside the gap — without closing it fully (its close stays above candle 1's high)
- Candles 2 and 3 are ideally of similar size — an outsized third candle changes the story
The entire pattern turns on the final condition. If the third candle closes the gap completely, the tasuki reading is void — a filled gap is failed support, not a held pullback (see gap-fill mechanics for why that distinction matters).
Market Psychology
The gap up on candle 2 is a show of force — demand strong enough to reprice the stock without trading at the skipped levels. Candle 3 is the test: profit-takers and short sellers push price back down into the gap, exactly where the breakaway would fail if it were going to. Buyers absorb the selling before the gap closes. A pullback was offered, taken, and contained — which is the trend's way of demonstrating that the repricing is accepted. In gap-taxonomy terms, candle 3 verifies that the gap is a runaway gap rather than an exhaustion gap.
Variations and Related Patterns
- Mirror image: the bearish downside tasuki gap — the identical structure in a downtrend, where a white candle probes a gap down and fails to close it.
- Cousins: the upside gap three methods shares the same first two candles, but its third candle does close the gap — and is still read as bullish continuation. The two patterns are easy to confuse and answer the same question differently, which is a good reason to treat the gap-close boundary strictly and demand confirmation either way.
- Side-by-side forms: the side-by-side white lines pattern also begins with an upside gap, but resolves it with two matching white candles above the gap instead of a probing black one.
Trading the Upside Tasuki Gap
Entry
The classical entry is on continuation after candle 3 — when price trades back above the black candle's open, or above candle 2's high for more confirmation. Entering during candle 3 itself is anticipatory: the pattern is not complete until the gap has visibly held.
Stop-Loss
Below the bottom of the gap (candle 1's high). That level is the entire premise — the pattern says the gap is support, so a close through it is a clean, mechanical invalidation.
Targets
As a continuation pattern, the working assumption is a resumption of the prior trend leg; traders commonly project toward the next resistance or trail the position behind swing lows or a fast moving average.
Combining With Indicators
- Volume: ideally heavy on the gap-up candle and lighter on the black probe — pressure on the advance, apathy on the pullback. Heavy volume on candle 3 that still fails to close the gap is also informative, in a different way: real supply was absorbed.
- Trend quality: the pattern presumes a healthy uptrend; an ADX reading confirming trend strength keeps the continuation premise honest.
- Gap context: a tasuki gap early in a trend (off a base) has more room to run than one appearing after months of advance, where the next gap is increasingly likely to be exhaustion.
Common Mistakes
- Accepting a closed gap. The most common error — if candle 3 closes the gap, the pattern is not a weaker tasuki, it is a different (and more ambiguous) situation entirely.
- Trading it counter-trend. The same three candles without a preceding uptrend are noise; the pattern is a continuation signal only.
- Ignoring candle proportions. A giant third candle that stops just short of the gap boundary is technically valid but psychologically weak — the sellers nearly won.
FAQs
How rare is this pattern? Genuinely rare on daily charts — it requires a mid-trend gap that survives an immediate direct test. Rarity cuts both ways: fewer signals, but each one carries a clear, testable premise.
Does a partial fill invalidate it? No — a partial probe into the gap is the pattern's defining feature. Only a complete close of the gap (candle 3 closing at or below candle 1's high) voids it.
Is confirmation necessary? Recommended. The nearby patterns that share its opening structure resolve differently, so waiting for price to clear the black candle's open costs little and removes most of the ambiguity.
Conclusion
The upside tasuki gap is a trend proving its own gap: force (the gap up), test (the black probe), and verdict (the gap holds). Its rules are unusually mechanical for a candlestick pattern — the gap boundary defines both the signal and the stop — which makes it one of the cleaner continuation setups to trade honestly, provided the trend context and the unfilled gap are both genuinely present.