Bullish Homing Pigeon
Updated Aug 26, 2026
- Signal
- Bullish Reversal
- Reliability
- Moderate
- Rarity
- Rare
- Confirmation
- Required
- Trend Position
- Downtrend Bottom
- Best Timeframes
- Daily+
On this page
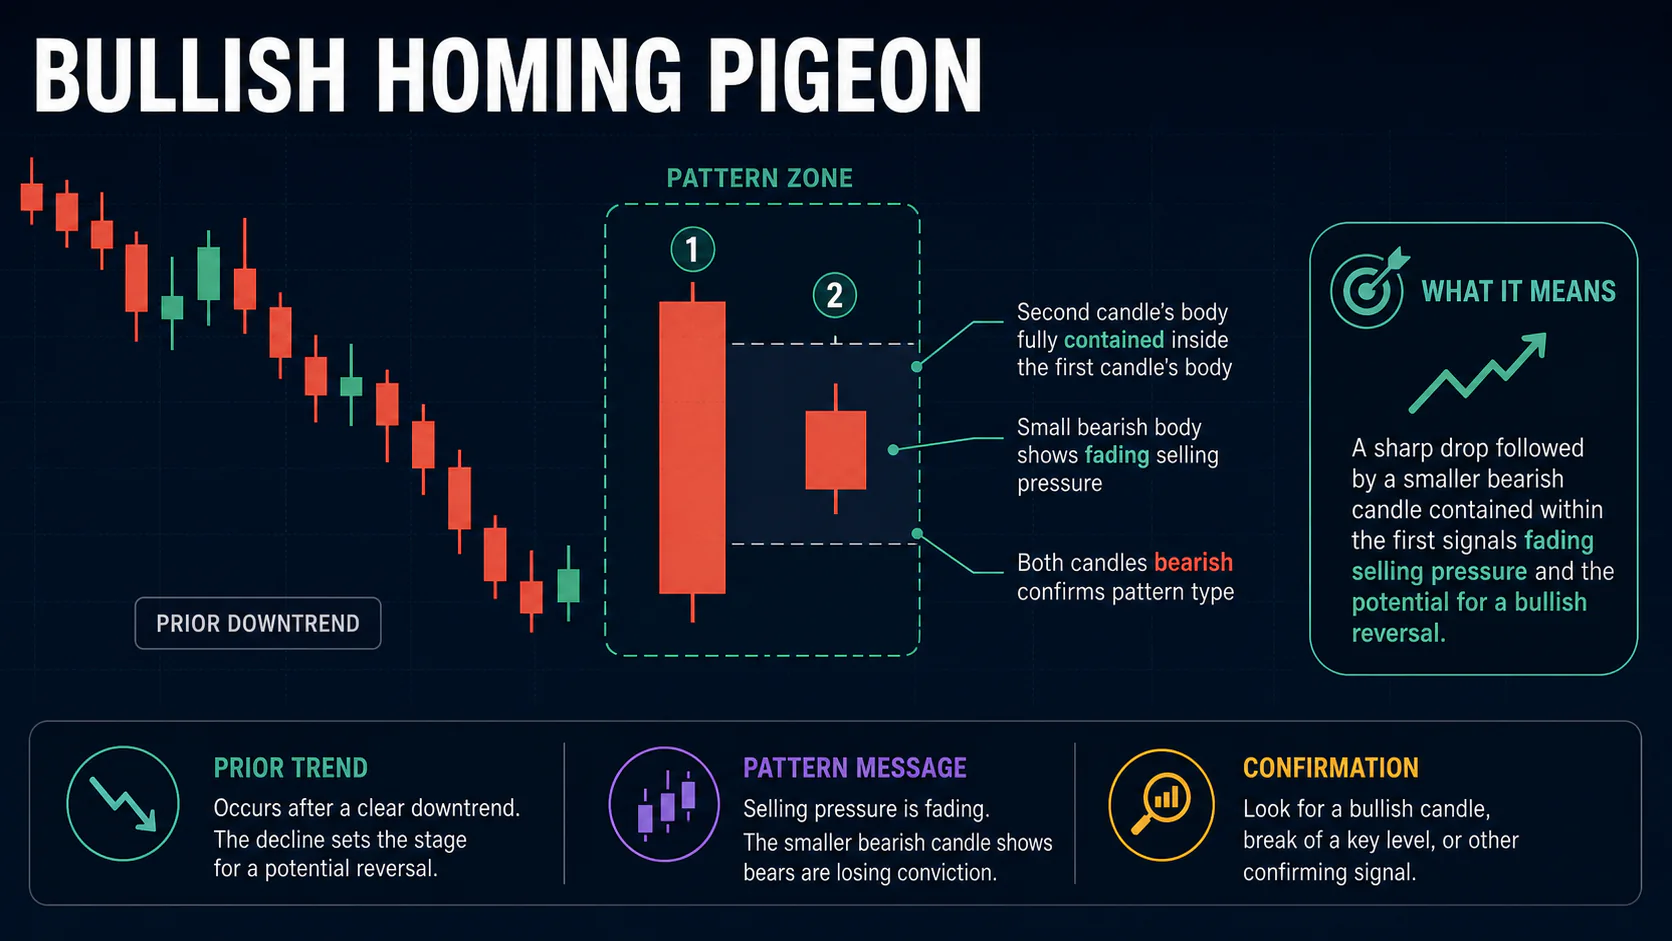
A bullish homing pigeon is a two-candlestick reversal pattern that appears after a downtrend: a large bearish candle is followed by a smaller bearish candle whose entire real body sits inside the first candle's body. Both candles are bearish, which makes the pattern easy to overlook, but the sharp drop in the size of the second candle's body shows selling pressure fading even though the color still looks negative. The name comes from the way the smaller second candle appears to fly back into the safety of the first candle's range.
Recognition Criteria
First Candle
A large bearish candle with a substantial real body, ideally on above-average volume. It should show clear directional conviction, with little upper shadow, and sets the containing range the second candle must sit inside. The bigger and more decisive this candle is, the more meaningful it is when the following session fails to extend that move.
Second Candle
Also bearish, but with a small real body completely contained within the first candle's body: both its open and close fall inside the first candle's open-close range. Volume should be noticeably lower than the first candle's, consistent with fading selling pressure rather than a fresh wave of selling arriving to push the trend further.
Critical Requirements
- Full containment: the second candle's body, not just its shadows, must sit entirely within the first candle's body.
- Both candles bearish: this is what distinguishes the pattern from a standard bullish harami, where the second candle is typically bullish.
- Meaningful size contrast: the first candle should be clearly larger than the second, a common guideline is roughly three times the body size or more.
- Downtrend context: the pattern needs a genuine prior decline to carry reversal significance.
Market Psychology
Peak Selling Pressure
The first candle shows sellers firmly in control, pushing price down with conviction on real volume, the kind of session that looks, in the moment, like the trend is accelerating rather than nearing its end.
Quiet Exhaustion
The second candle is still bearish in color, but its narrow range shows sellers could not extend the prior session's momentum. Volatility contracts sharply even though the market technically closed lower again, and lower volume on this session reinforces the idea that fewer participants are willing to sell at these levels.
A Subtler Signal
That combination of a bearish close with a shrinking range is a subtler signal than an outright reversal candle: it suggests the selling is running out of steam under the surface, even while still nominally bearish, which is why some buyers may begin positioning ahead of a more obvious signal appearing. This is also why the pattern is easy to miss on a casual scan of a chart, since at first glance both candles simply look like continued weakness.
Variations
Classic homing pigeon: a large bearish first candle and a small bearish second candle fully contained within it, with a clear drop in volume.
Support-level homing pigeon: the pattern forms exactly at a significant support level, adding technical confluence to the containment signal.
Deep-containment homing pigeon: the second candle sits well within the lower portion of the first candle's body rather than near its midpoint, which can suggest the contraction in selling pressure is occurring closer to the point of maximum prior weakness.
Why the Pattern Is Easy to Overlook
Most reversal candlesticks announce themselves with an obvious change, a long shadow, a shift in color, or a gap. The homing pigeon does none of that: both candles are bearish, there is no gap, and the overall visual impression on a quick glance is simply "still going down." What actually distinguishes it is a size and volume comparison between two consecutive sessions, which requires a slightly closer look than spotting a dragonfly doji or an engulfing pattern. This is precisely why it is worth specifically checking for containment and volume contraction after any large bearish session, rather than assuming that a smaller down day that follows is automatically insignificant.
Market Context
The pattern is most meaningful after a sustained decline that has already produced one or more large bearish sessions, rather than at the start of a new move down. Because both candles remain bearish, the setup is easy to dismiss as simple trend continuation unless you are specifically looking for the contraction in range and volume that defines it, which is also why confirmation from the following sessions matters more here than for a more visually obvious reversal candle. It is worth comparing the pattern's volume profile with recent history: a genuine homing pigeon should stand out as an unusually quiet session relative to what came before it, not just a routine smaller candle.
Trading the Bullish Homing Pigeon
Because the pattern is subtle rather than dramatic, it tends to reward traders who are already watching a stock closely for other reasons, such as a support level or an oversold reading, rather than those scanning for eye-catching candle shapes alone.
Entry
Wait for a subsequent session to close above the high of the entire two-candle pattern, confirming that buyers have taken control. A gap up with strong volume is the clearest form of confirmation, since it shows the market moving decisively away from the containment range rather than merely drifting above it.
Stop Loss
Place stops below the low of the pattern, typically the first candle's low, since the second candle's low sits inside it. Any break below that level negates the containment signal and suggests the earlier contraction in selling was only a pause rather than genuine exhaustion.
Profit Targets
Keep targets conservative and tied to nearby resistance, given the pattern's subtlety. Some traders project the height of the first candle upward from the confirmation breakout as a rough guide, adjusting to actual resistance levels rather than following the projection mechanically.
Confirmation and Combining with Indicators
It is also worth checking whether the stock's typical daily range has been contracting over several sessions leading into the pattern, not just between these two candles specifically, since a broader volatility squeeze reinforces the same exhaustion story the homing pigeon tells on its own.
Supporting signals include deeply oversold RSI with bullish divergence, and formation at a well-tested support level or major moving average. The pattern is structurally similar to a bullish harami, with the key difference that the homing pigeon's second candle is also bearish rather than bullish, which is why it is generally treated as a subtler, lower-conviction cousin of that more familiar pattern.
Common Mistakes
Recognition Errors
- Accepting a second candle whose body is not fully contained within the first; partial overlap does not qualify.
- Ignoring the volume-decline requirement that distinguishes genuine exhaustion from ordinary consolidation.
Trading and Risk Mistakes
- Trading the pattern outside of a genuine downtrend.
- Entering without confirmation, since a subtle two-candle pattern like this is easy to misread.
- Dismissing the setup simply because both candles look bearish, without checking the containment and volume characteristics that actually define it.
FAQs
How is this different from a bullish harami?
In a classic bullish harami, the second, smaller candle is typically bullish. In a homing pigeon, the second candle is still bearish; it is the shrinking range and body size, not a change in color, that signals fading selling pressure.
Why is a bearish-looking pattern considered bullish?
Because the meaningful signal is the sharp contraction in range and volume compared to the prior session, not the candle's color. It's a subtle, early-stage exhaustion signal rather than a decisive reversal.
Is this a common pattern?
No, it's considered relatively rare, and its subtlety means it is also easy to misidentify, so careful confirmation of full containment matters.
Can the second candle be a doji instead?
If the second candle's open and close are essentially equal, the pattern is generally better classified as a bullish harami cross rather than a homing pigeon, though both share the same containment idea.
Does the pattern work the same way on lower timeframes?
The same logic applies, but on shorter timeframes ordinary noise more easily produces a small candle contained within a larger one, so the pattern is generally considered more meaningful on daily and higher charts.
What if the second candle's volume is not much lower than the first's?
The pattern can still technically qualify on price alone, but the volume contraction is an important piece of supporting evidence, and its absence should lower your confidence in the exhaustion reading.
Is the homing pigeon more or less reliable than a dragonfly doji?
Both carry moderate reliability, but they signal different things. The dragonfly doji shows a decisive intraday rejection within a single session, while the homing pigeon shows a quieter, two-session contraction in selling pressure. Neither is inherently stronger; the dragonfly is simply the more visually obvious of the two.
Conclusion
The bullish homing pigeon is a subtle pattern: two bearish candles where the second is completely swallowed by the first, signaling that selling pressure is fading even though the market technically closed lower again.
It's a lower-conviction signal than an outright reversal candle, which is why confirmation and supporting context matter more than usual before acting on it. Learning to spot it is nonetheless useful, since it can offer an earlier read on fading momentum than waiting for a more obvious, visually striking reversal candle to appear.