Bullish Dragonfly Doji
Updated Aug 26, 2026
- Signal
- Bullish Reversal
- Reliability
- Moderate
- Rarity
- Common
- Confirmation
- Required
- Trend Position
- Downtrend Bottom
- Best Timeframes
- Daily+
On this page
A dragonfly doji is a single-candle pattern in which the open, high, and close all occur at or near the same price while the low sits well below, leaving one long lower shadow and little or no body or upper shadow. Visually it resembles a dragonfly with a long tail and almost no head. When it forms after a decline, it shows that sellers pushed the price sharply lower during the session but buyers reclaimed nearly all of that ground by the close. This is one of the more common doji variants and is conventionally read as bullish at the bottom of a downtrend, provided the reversal is confirmed by the next session.
Recognition Criteria
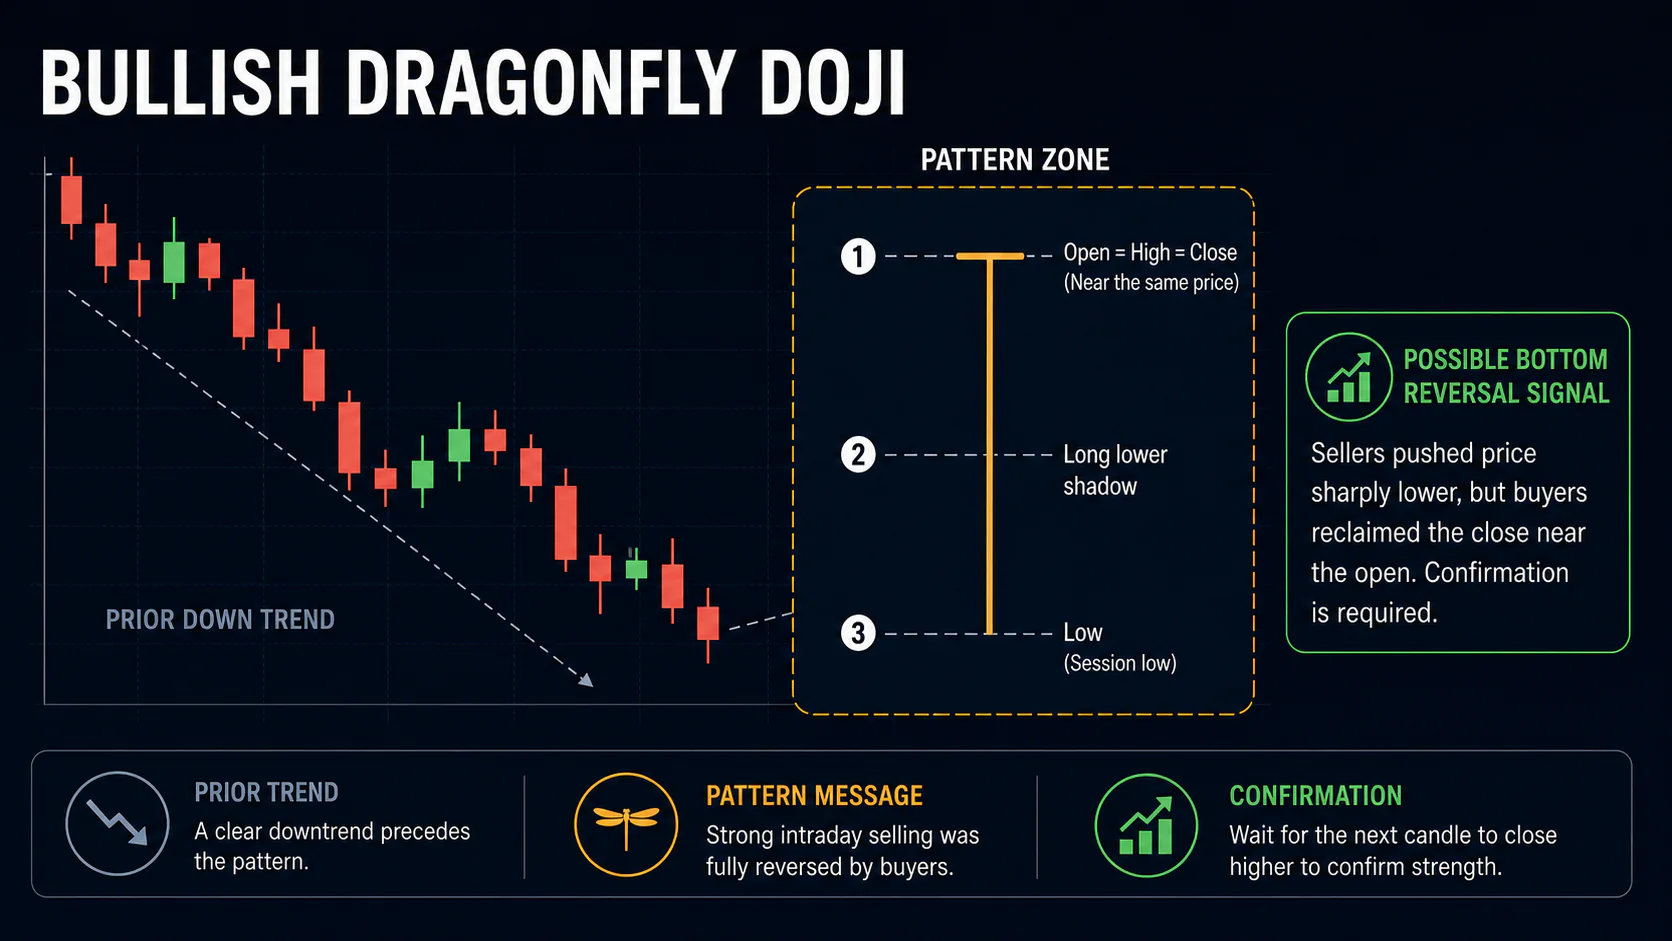
Because this is a single-candle pattern, the entire story plays out in one session. Price opens at a specific level, sellers drive it meaningfully lower during the session, creating the long lower shadow that defines the shape, and then buyers step in with enough force to halt the decline and push the close back up near the open. The result is a candle with a negligible real body, a long lower wick, and little or nothing above the body.
Core Requirements
- Open and close nearly identical: the essential doji requirement, so the real body is negligible.
- Long lower shadow: conventionally at least twice the length of the tiny body, showing a significant intraday decline that was fully reversed.
- Minimal or no upper shadow: buyers controlled the top of the range into the close.
- Downtrend context: the pattern only carries bullish-reversal meaning when it follows a clear decline; in an uptrend or sideways market it is just a doji.
- Volume: above-average volume during the session adds weight to the reversal read, since it suggests genuine participation rather than a low-liquidity fluctuation, though it is not a strict requirement.
Visual Recognition
A well-formed dragonfly doji is easy to spot: a long, thin lower wick beneath a flat top where the open, high, and close converge. The lowest point of that lower shadow often marks a level buyers were specifically defending, which is useful to note when placing a stop later. On a chart filled with ordinary candles, a genuine dragonfly stands out precisely because so little of the session's range is occupied by the body.
Market Psychology
The Decline
The early-session weakness can come from several sources: continuation of overnight selling, a reaction to negative news, a technical breakdown that draws in more sellers, or stop-loss orders being triggered from existing long positions. Whatever the cause, sellers appear to be firmly in control at that point in the session.
The Reversal
The recovery back toward the opening price shows that buyers found the lower price attractive enough to step in and absorb the available supply. The faster and more complete that recovery, the more convincingly it suggests real buying interest rather than a brief technical bounce.
What It Means Going Forward
A single dragonfly doji does not, by itself, confirm a trend change. It shows that for one session buyers were able to fully negate the day's selling pressure. That is a meaningful shift in the intraday balance of power, but it needs to be followed by continued buying in the sessions after it before it becomes a genuine trend-reversal signal rather than a one-day anomaly. Two important variables to weigh are how deep the intraday decline was before the reversal, and how quickly the recovery unfolded once it began; a dragonfly that recovers sharply from a steep intraday low generally reflects more conviction than one that drifts back to the open gradually over a quiet session.
Variations
Classic dragonfly: open and close are identical, with a clean, long lower shadow and no upper shadow, the most recognizable form of the pattern.
Near-perfect dragonfly: open and close differ by a small fraction of a percent, which is normal in real markets and does not invalidate the pattern; strict, exact equality is rare outside of very liquid instruments.
Support-level dragonfly: forms exactly at a prior swing low, trendline, or moving average, adding technical confluence to the signal and giving the level a second reason to hold beyond the candle itself.
Gap-down dragonfly: opens with a gap down but still recovers to close near the prior session's close, which can indicate a stronger-than-usual rejection of lower prices since the starting point for the decline was already lower than the prior close.
Long-shadow dragonfly: the more pronounced the lower shadow relative to the body, the more forcefully the intraday decline was rejected, though an unusually long shadow can also reflect a news-driven spike that is harder to sustain, so a longer shadow is not automatically a stronger signal on its own.
Market Context
The pattern carries more weight the more oversold the broader setup looks: a stock or index that has declined for an extended period, is testing a well-established support level, or otherwise shows signs that selling pressure is fading. A dragonfly doji that appears in the middle of a mild pullback, away from any meaningful support, is a much weaker signal than one that forms after a sustained decline at a level buyers have defended before. Because it is only a single candle, it is also more easily overridden by the next session than a multi-candle reversal pattern, which is one reason confirmation matters so much here.
Trading the Bullish Dragonfly Doji
Entry
Most traders wait for the following session to close above the dragonfly's high before entering, confirming that buyers followed through. More aggressive traders may enter intraday during the confirmation session once it shows sustained buying with supportive volume, accepting a slightly worse average price in exchange for an earlier entry. A middle-ground approach is to enter on a gap up above the dragonfly's high at the next session's open, which still requires the market to confirm the signal but does not wait for the full session to close first.
Stop Loss
Place stops below the low of the dragonfly's shadow, since a move back below that level undoes the rejection the pattern represents. Some traders add a small percentage buffer below that low to allow for normal volatility, and it is reasonable to abandon the setup on a time basis if confirmation has not appeared within a few sessions, freeing up capital for other opportunities.
Profit Targets
Target the next meaningful resistance level: a prior swing high, a moving average, or a round number. A common rough guide is to project the length of the lower shadow upward from the close as a minimum expectation, then adjust to actual resistance rather than trading the projection mechanically. Taking partial profits at the first resistance level while letting a smaller portion run is a reasonable way to balance the pattern's moderate reliability against its upside potential, and it reduces the chance of giving back the entire gain if the reversal stalls.
Confirmation and Combining with Indicators
The pattern is more convincing when it aligns with other evidence of an oversold condition: RSI below 30 or showing bullish divergence, a stochastic or MACD turn from oversold levels, and the dragonfly forming precisely at a well-tested support level or major moving average. Rising volume on the confirmation session, or an on-balance-volume line that has stopped making new lows, adds further weight. None of these are required, but their presence raises confidence in the reversal, particularly for traders who prefer not to act on a single candlestick pattern in isolation.
Common Mistakes
Recognition Errors
- Accepting candles with a meaningfully sized real body as a "doji," which dilutes the pattern's psychology.
- Ignoring the shadow-to-body proportion and trading any candle that simply has a lower wick.
- Trading the pattern outside of a genuine downtrend, where it has no reversal significance.
Trading and Risk Mistakes
- Entering before confirmation, since a single candle can easily be overridden the next session.
- Disregarding volume entirely rather than treating it as one input among several.
- Using a full-size position on a pattern with only moderate reliability rather than sizing to reflect that.
FAQs
Is a dragonfly doji always bullish?
Only in context. It is read as a bullish reversal signal specifically when it appears after a downtrend. The same candle shape appearing in an uptrend or a sideways range does not carry that meaning.
How is it different from a hammer?
A hammer has a small but visible real body and a long lower shadow; a dragonfly doji requires the open and close to be essentially equal, making it a stricter, less common version of the same rejection idea.
Do I need to wait for confirmation?
Yes. As a single-candle pattern it is more prone to false signals than multi-candle reversals, so a confirming close above the pattern's high in the next session or two is standard practice.
Does volume matter for this pattern?
Higher volume during the session adds some confidence that the reversal reflects real participation rather than a low-liquidity fluctuation, but it is not a strict requirement.
What invalidates the pattern?
A subsequent close below the dragonfly's low undermines the idea that buyers defended that level and typically invalidates the setup.
Can a dragonfly doji appear more than once in the same decline?
Yes, and multiple attempts at the same support level, each producing a long lower shadow, can strengthen the case that the level is being genuinely defended, though each individual candle still needs its own confirmation.
Does the pattern work the same way on weekly charts?
The same recognition rules apply, and a weekly dragonfly doji can carry more significance simply because it summarizes a longer period of trading, but it should still be confirmed by the following week's action rather than acted on alone.
Conclusion
The dragonfly doji is a straightforward, visually clear single-candle reversal signal: a sharp intraday sell-off that buyers fully reverse by the close. It occurs often enough to be a useful tool, but as with any single-candle pattern its value comes from context: a genuine downtrend, a supportive level, and confirmation in the sessions that follow.
Its mirror-image counterpart at market tops is the gravestone doji, which is normally read as bearish. Comparing the two is a useful way to remember that the position of the shadow, not just the presence of a doji, is what determines a candle's conventional meaning.