Bullish Harami
Updated Aug 26, 2026
- Signal
- Bullish Reversal
- Reliability
- Moderate
- Rarity
- Common
- Confirmation
- Recommended
- Trend Position
- Downtrend Bottom
- Best Timeframes
- Daily+
On this page
A bullish harami is a two-candlestick reversal pattern that appears after a downtrend. The first candle is a large bearish candle; the second is a much smaller candle whose entire trading range sits within the first candle’s real body. “Harami” is a Japanese word meaning “pregnant,” describing how the small second candle appears to be carried inside the larger first candle.
Recognition Criteria
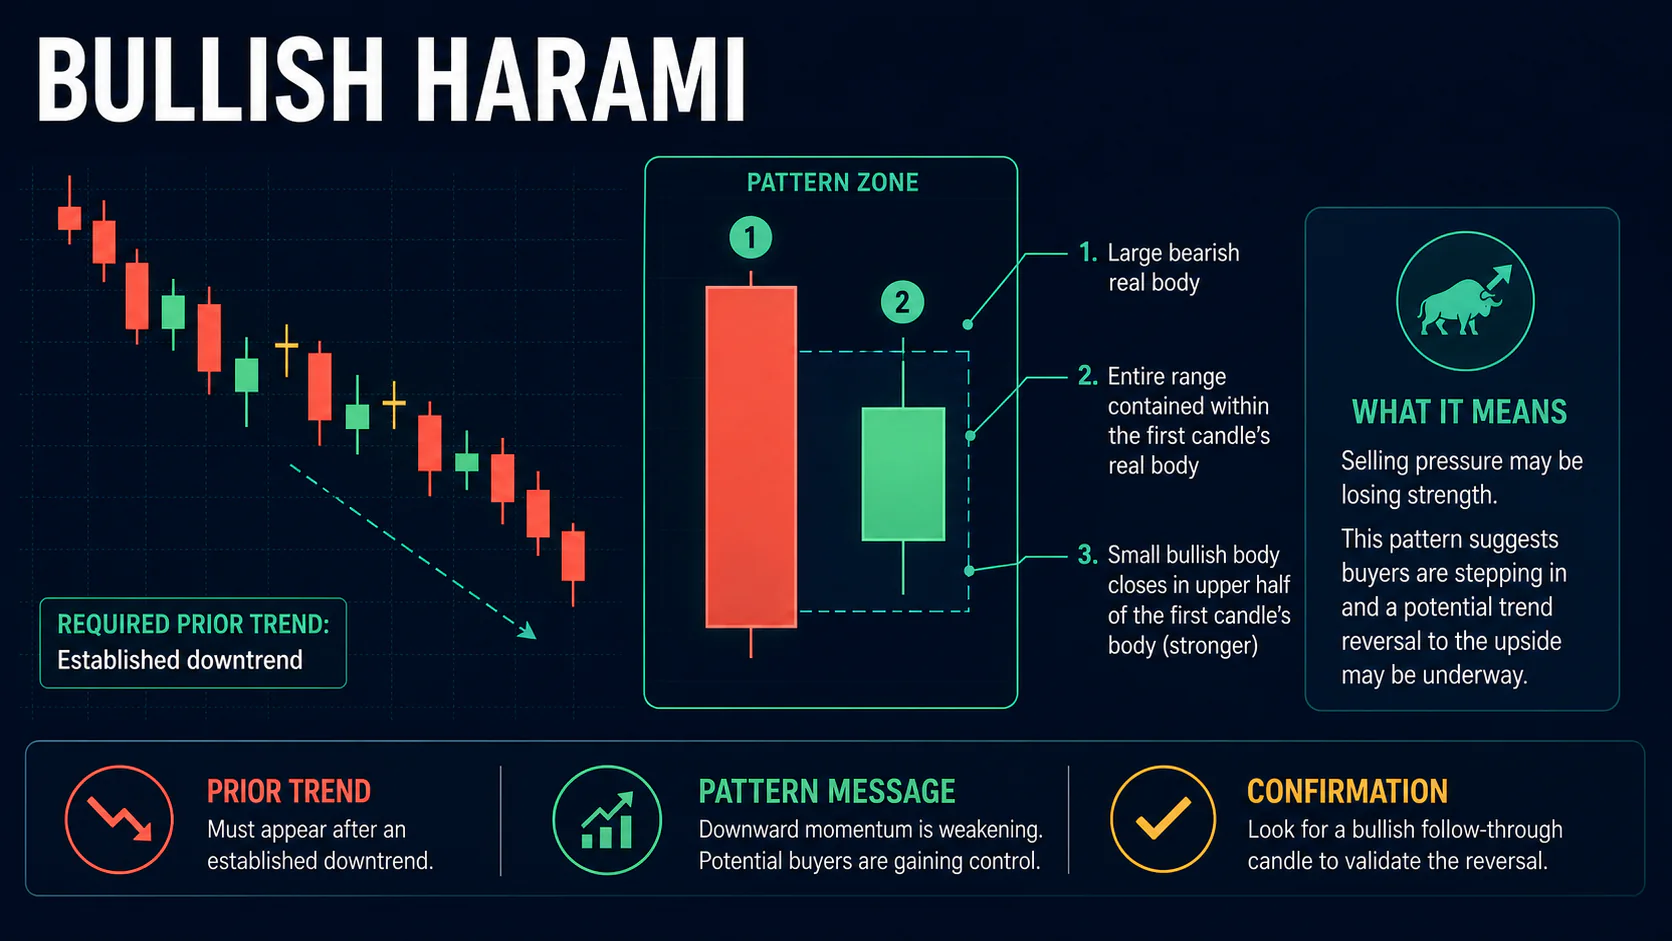
First candle (mother candle): A large bearish candle with a substantial real body, representing continued selling pressure and minimal upper shadow.
Second candle (baby candle): A noticeably smaller candle whose entire range — both its body and any shadows — sits inside the first candle’s real body. It’s usually bullish, though the essential test for a harami is containment, not the second candle’s color.
- The pattern must appear after an established downtrend
- The second candle’s full trading range must fit entirely within the first candle’s real body, not just its closing price
- The first candle should be noticeably larger than the second — the size contrast is what creates the pattern’s visual and psychological impact
- A second candle that closes in the upper half of the first candle’s body is generally viewed as a somewhat stronger version
Market Psychology
The first candle shows sellers firmly in control, pushing price meaningfully lower. The second candle, contained entirely within that range, shows a sudden contraction in volatility and conviction — neither side can extend the prior session’s move. That contraction often signals that selling pressure is running out of steam, since sellers were unable to push price to a new low and the market has effectively paused to reassess. A harami doesn’t show buyers taking control the way an engulfing pattern does; it shows sellers losing control, which is a meaningfully different (and generally more tentative) signal.
Variations
A harami cross forms when the second candle is a doji rather than simply a small body, reflecting even more pronounced indecision and generally viewed as a somewhat stronger version. A harami where the second candle sits in the upper third of the first candle’s body, showing a clearer bullish lean, is sometimes considered a cleaner setup than one where the second candle sits near the middle or bottom of the range. Formation at a well-established support level adds weight to any version of the pattern.
Trading the Harami
Entry
Because a harami signals reduced selling pressure rather than a confirmed reversal, most traders wait for a third candle to close above the harami’s high before entering, confirming that buyers have actually taken control rather than the pause simply resolving back to the downside.
Stop-Loss
Stops are commonly placed below the harami’s low (the lower of the two candles’ lows), since a break below that level would suggest the downtrend has resumed. A stop at the low of just the second candle offers a tighter, though more easily triggered, alternative.
Targets
Nearby resistance is the most realistic initial target. Some traders project the height of the first candle upward from the harami’s high as a rough estimate, but only once confirmation has occurred, since the pattern alone doesn’t demonstrate the same buying conviction as an engulfing pattern or piercing line.
Confirmation
Confirmation means a subsequent close above the harami’s high, ideally with volume that picks up relative to the quiet second candle. Because the harami itself reflects indecision rather than decisive buying, confirmation matters more here than it does for patterns like the engulfing pattern, where the reversal is already more fully expressed in the two candles themselves.
Combining With Indicators
A harami forming while the RSI is oversold, or near a major moving average or Fibonacci retracement level, carries more weight than one appearing without any such context. A bullish MACD or stochastic crossover developing around the time of confirmation offers additional, independent support. These indicators provide useful context but don’t substitute for the pattern’s own structural requirements.
Common Mistakes
- Accepting a second candle whose shadow pokes outside the first candle’s real body — containment must be complete, not partial
- Treating the harami itself as a strong buy signal rather than as a sign of stalling momentum that still needs confirmation
- Ignoring the size contrast between the two candles — a second candle too close in size to the first weakens the pattern’s significance
- Trading haramis that form in a sideways market rather than after a genuine downtrend
FAQs
Does the second candle have to be bullish?
Not strictly. The defining test is containment — the second candle’s full range sitting inside the first candle’s real body. A bullish second candle is the most common and slightly more convincing version, but the core pattern is about the size and containment relationship.
How is a harami different from a bullish engulfing pattern?
They’re close to opposites. In an engulfing pattern, the second candle’s body is larger and contains the first. In a harami, the second candle’s body is smaller and sits inside the first.
What is a harami cross?
It’s a harami where the second candle is a doji instead of a small-bodied candle. The added indecision of a true doji generally makes the harami cross a somewhat stronger signal than a standard harami.
Why does a harami need more confirmation than an engulfing pattern?
An engulfing pattern shows buyers actively overpowering the prior session. A harami only shows sellers losing momentum — it doesn’t yet show buyers in control, which is why a confirming close above the pattern’s high matters more here.
Conclusion
The bullish harami is a common, easy-to-spot pattern that flags a stall in selling pressure after a decline: a large bearish candle followed by a much smaller candle fully contained within it. Because it reflects indecision rather than a decisive shift to buying, it calls for more patience than stronger reversal signals — confirmation from a subsequent close above the pattern’s high, ideally near a genuine support level, before treating it as an actionable reversal.