Bullish Tri Star
Updated Aug 26, 2026
- Signal
- Bullish Reversal
- Reliability
- High
- Rarity
- Extremely Rare
- Confirmation
- Required
- Trend Position
- Downtrend Bottom
- Best Timeframes
- Daily+
On this page
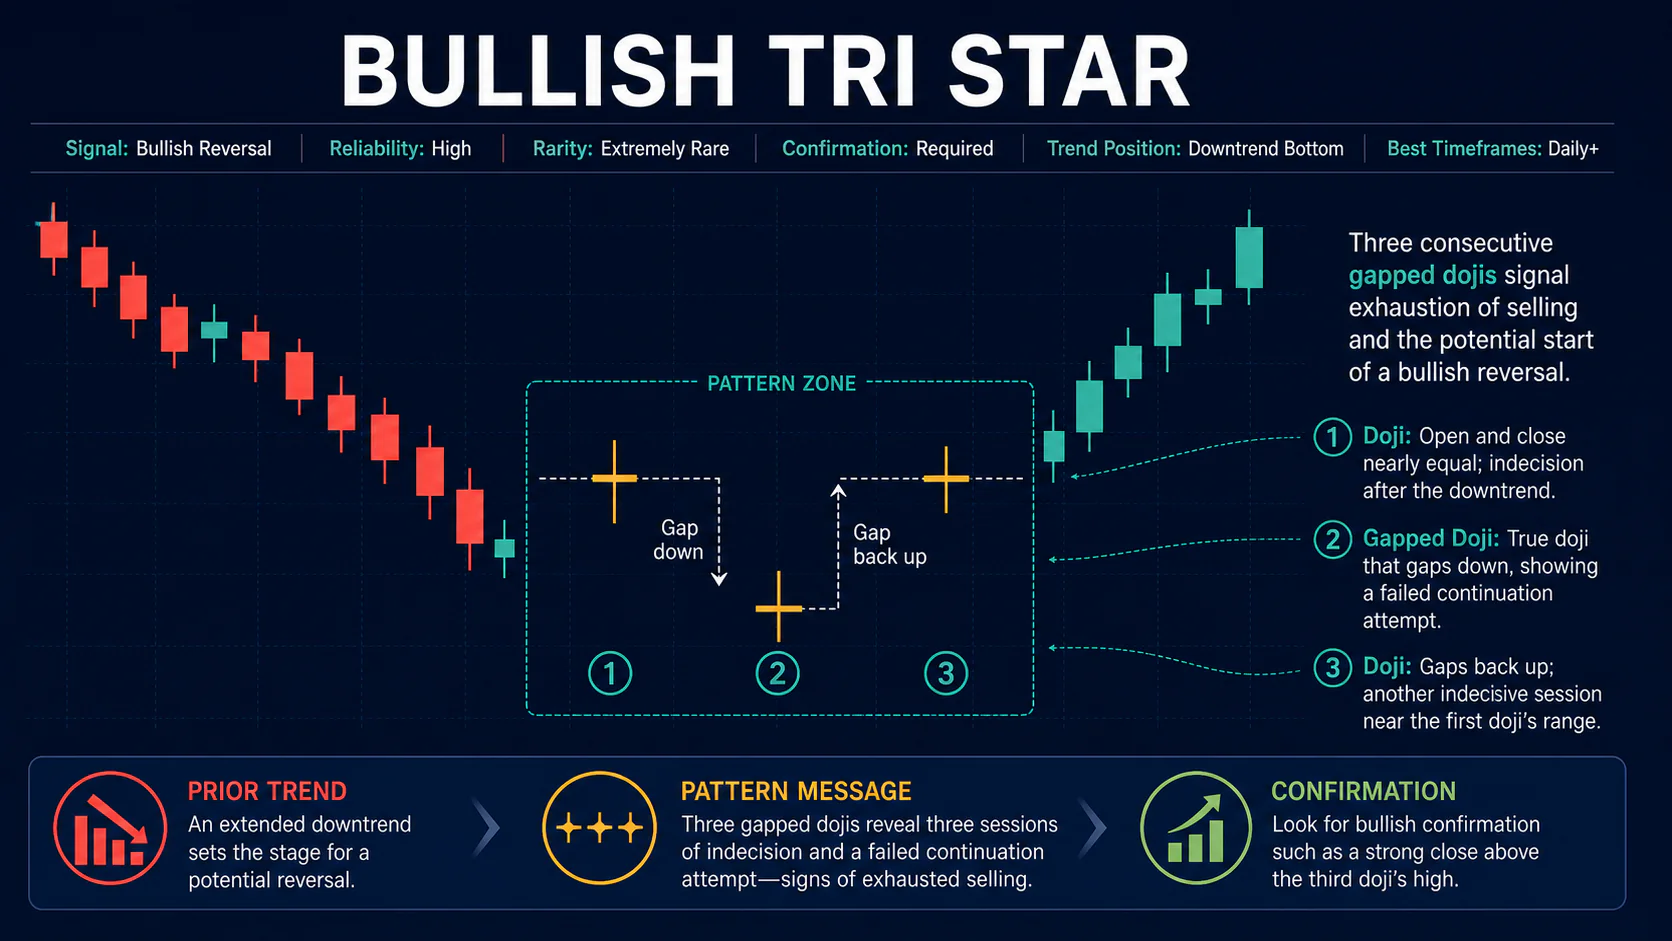
A bullish tri star is a three-candlestick reversal pattern made up of three consecutive doji candles, with the middle doji gapping away from the other two. Each candle shows the open and close at or near the same price, so three in a row means the market failed to establish direction across three full sessions despite the gap attempt in the middle. It is one of the rarest candlestick patterns in Japanese charting and, when it appears after an extended downtrend, is regarded as a strong signal that selling momentum has been exhausted.
Recognition Criteria
First Doji
A doji forms with open and close nearly identical, following a period of established selling. On its own this candle simply shows the first crack in the prior trend's momentum, a session where sellers could not extend the decline despite having been in firm control up to that point.
Second Doji
The critical middle candle. It must also be a true doji, and it should gap away from the first doji, typically gapping lower in a downtrend context, creating the visual separation that gives the pattern its "star" appearance. The market attempts to resume the prior trend via the gap, but still cannot produce a decisive directional session even after that fresh attempt.
Third Doji
A final doji completes the sequence, ideally gapping back toward the first doji's range, though this is a less strict requirement than the middle gap. Three consecutive sessions of indecision, bracketing a failed directional attempt, is what makes the pattern rare and, when genuine, significant.
Critical Requirements
- Three consecutive true dojis: each candle must show open and close nearly identical, with a small real body.
- Middle doji gaps away: the second doji should gap below the first (in a downtrend), creating the visual separation that defines the formation.
- Extended downtrend context: the pattern only carries reversal significance after a meaningful prior decline, not a shallow pullback.
- Volume: volume often declines through the three sessions, consistent with fading interest from both sides rather than active accumulation or distribution.
Market Psychology
Trend Breakdown
The first doji shows the prevailing downtrend losing momentum. Neither side can maintain lasting control, and volatility begins to contract as conviction fades on both sides after what may have been an extended, one-sided move.
The Failed Gap
The middle doji's gap represents an attempt to resume the trend. That the session still closes back near its open, despite the gap, shows the market immediately returning to equilibrium rather than following through, a stronger statement of exhaustion than a single doji on its own would provide.
Confirmation of Exhaustion
The third doji shows the market unable to establish direction for a third consecutive session. Sustained indecision of this length, after an extended decline, is unusual enough that it is typically read as the market reaching a genuine standstill before the next directional move, rather than simply a quiet stretch of trading.
Variations
Classic tri star: three clean dojis with a clear gap on the middle candle and declining volume.
Symmetrical tri star: the third doji gaps back toward the first doji's range, giving the formation a more visually balanced appearance.
Support-level tri star: the sequence forms at a significant horizontal support level or trendline, adding technical confluence.
Extended-indecision tri star: an additional small-bodied candle appears immediately before or after the three-doji sequence, suggesting an even more prolonged period of exhaustion, though the core three-doji structure remains the defining feature.
Distinguishing a True Tri Star
Because true dojis are themselves somewhat uncommon, it is worth being strict about what counts. A candle with a small but clearly visible real body is a spinning top, not a doji, and three spinning tops in a row, however visually similar, is not a tri star. Likewise, an overlap between the middle candle and either of its neighbors, even a small one, removes the visual separation that gives the pattern its name and its significance. When in doubt about whether a sequence qualifies, it is generally safer to treat it as an unusually indecisive stretch of trading rather than force it into the tri star label, since the pattern's reputation for reliability is built specifically on the rigor of its definition.
Market Context
Because the tri star is so rare, context does most of the work in separating a meaningful occurrence from a coincidental run of quiet sessions. It matters most when the prior downtrend has been sustained for weeks or months, when the sequence forms at or near a level that has previously acted as support, and when broader volatility appears to be contracting into the pattern rather than expanding. A three-doji sequence that appears early in a decline, or in a market that is otherwise choppy and directionless, does not carry the same exhaustion implication. It is also worth checking whether other stocks in the same sector are showing similar signs of fatigue around the same time, since a tri star that coincides with broader exhaustion carries more weight than one that appears in isolation.
Trading the Bullish Tri Star
Entry
Wait for the session following the third doji to close decisively above the pattern's high, ideally with expanding volume, before entering. Given the pattern's rarity, some experienced traders will take a smaller initial position at the completion of the third doji, adding on confirmation rather than waiting for the full breakout, since a genuine tri star at least removes some of the guesswork around whether the prior trend still has conviction behind it.
Stop Loss
Place stops below the lowest point of the entire three-candle formation. Any break below that level undermines the exhaustion thesis the pattern represents. Because the setup is rare and the invalidation level is unambiguous, a wider buffer is generally preferable to an overly tight stop that risks being caught by normal post-pattern volatility.
Profit Targets
Target the next significant resistance level or a standard retracement of the preceding downtrend, for example, prior swing highs. Because the pattern signals more than a minor bounce, some traders hold part of the position for a larger move rather than taking full profits at the first resistance level, scaling out gradually as higher resistance levels are reached rather than exiting the entire position at once.
Confirmation and Combining with Indicators
Additional confidence comes from deeply oversold RSI with bullish divergence, MACD approaching or crossing its zero line, and formation at a well-established support level. A related but far more common single-candle version of the same indecision idea is the long-legged doji, which can be a useful comparison for understanding how the tri star's three-session version of indecision differs from a single session of it, and why the repetition across three sessions is treated as far more significant.
Common Mistakes
Recognition Errors
- Accepting candles that are not true dojis; a visibly sized real body disqualifies them.
- Overlooking the requirement for a gap on the middle candle, which is what separates this from three dojis appearing consecutively by coincidence.
Trading and Risk Mistakes
- Trading the pattern outside of a genuine, extended downtrend.
- Because the pattern is so rare, mistaking a more common two-doji or single-doji formation for a tri star.
- Setting overly conservative targets that fail to reflect the pattern's implication of a larger, not just short-term, trend change.
FAQs
Why is the tri star so rare?
It requires three consecutive true doji sessions with a specific gap structure, a combination that simply does not occur often, especially on daily charts.
Does the gap have to be large?
No fixed size is required, but a clear, visible gap is necessary to create the separation that defines the pattern; a marginal overlap does not qualify.
How does it relate to the abandoned baby pattern?
Both are rare reversal patterns built around a doji, but the abandoned baby uses a single isolated doji gapped away from a large bearish candle on one side and a large bullish candle on the other, while the tri star uses three consecutive dojis.
Is confirmation really necessary given the pattern's high reliability?
Yes. High reliability in candlestick literature does not mean certainty, and because the pattern is so rare, there is limited data on its real-world performance, so confirmation remains the standard risk-management step.
What if the third doji doesn't gap back toward the first?
The pattern is still valid; the gap on the middle candle is the defining structural requirement, while symmetry in the third doji's position is a nice-to-have rather than a strict rule.
Can a tri star form in an uptrend as a bearish signal?
Yes, the same three-doji, gapped-middle structure appearing after an extended uptrend is generally read as a bearish exhaustion signal rather than a bullish one; the direction of the prior trend, not the candle sequence itself, determines which way the exhaustion points.
Should I still look for this pattern given how rarely it occurs?
It is worth knowing how to recognize, mainly so you do not misread a more common pattern as a tri star, but building a strategy that depends on waiting for one to appear is impractical given how infrequently a genuine example forms; most traders treat it as a bonus signal to watch for rather than a core setup to plan around.
Conclusion
The bullish tri star is one of the rarest formations in candlestick analysis: three consecutive dojis with a gap in the middle, appearing after an extended downtrend. Its rarity is part of why it is taken seriously when it does appear.
That reliability still depends on genuine downtrend context, a real gap structure, and confirmation from the sessions that follow; the pattern's scarcity is a reason for careful identification, not a reason to skip the usual risk-management steps.