Bullish Side-by-side White Lines
Updated Aug 26, 2026
- Signal
- Bullish Continuation
- Reliability
- Moderate
- Rarity
- Rare
- Confirmation
- Recommended
- Trend Position
- Mid-Trend
- Best Timeframes
- Daily+
On this page
Bullish Side-by-Side White Lines is a three-candle continuation pattern that appears during an uptrend. A bullish candle gaps up from the prior candle, and then two more bullish candles of similar size open near the same level, sitting side by side on the chart. Rather than the gap being faded by profit-taking, the two matching candles show buyers continuing to accumulate at the higher price — a sign that the gap is likely to hold and the uptrend is likely to continue.
How to Recognize the Pattern
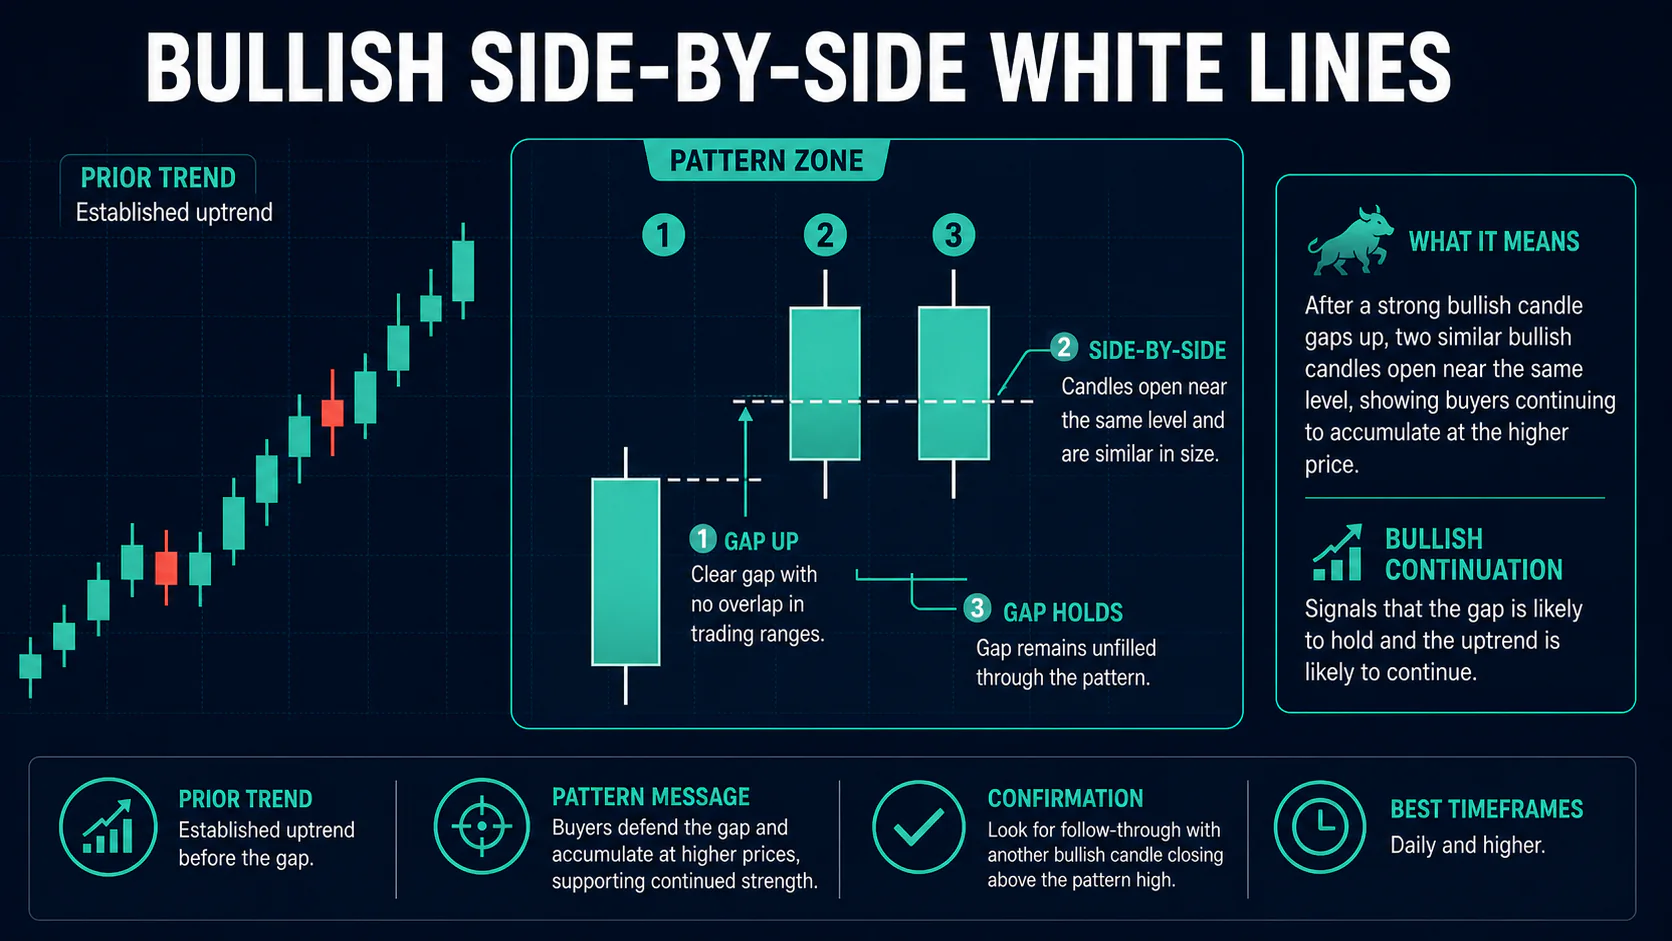
- First candle: a bullish candle continuing the existing uptrend.
- Gap up: a clear gap between the first candle's close and the next candle's open, with no overlap in trading ranges.
- Second and third candles: two bullish candles that open at approximately the same level and are similar in size to each other, effectively sitting side by side just above the gap.
The similarity in size and opening level between the second and third candles is what defines the pattern — two candles that happen to both be bullish after a gap, but differ significantly in size or open well apart from each other, don't really form the side-by-side structure the name describes.
| Check | What to look for |
|---|---|
| Prior trend | Established uptrend before the gap |
| Gap | Clear, non-overlapping gap up between the first and second candles |
| Second and third candles | Both bullish, similar size, opening near the same level |
| Gap status | Should remain unfilled through the formation |
Market Psychology
The gap up shows an initial burst of buying strong enough to jump price to a new level without any trading in between. The concern with any gap is that it gets faded — early buyers take profits and the price drifts back down to fill it. The second candle opening near the gapped-up level and closing higher shows that isn't happening: new buyers are willing to pay the higher price rather than waiting for a pullback. The third candle repeating that same behavior reinforces the point — this isn't a one-session fluke, it's sustained demand holding the gap. Because the pattern shows buyers defending a gap rather than retreating from it, it reads as evidence the uptrend still has support behind it.
Variations
Slight upward drift: often the third candle closes a touch higher than the second rather than at an identical level — the pattern still applies as long as the general side-by-side character holds.
Extended version: occasionally three or more candles form at the gapped-up level instead of two, creating a longer consolidation before the next move. The core logic doesn't change — the gap still needs to hold — but the longer the level is defended, the more significant it tends to be as a support shelf.
Volume-confirmed formation: when both side-by-side candles show comparable or increasing volume rather than one heavy candle followed by a quiet one, it points to broader participation rather than a single large buyer defending the level alone.
How It Differs From Similar Patterns
The pattern is closely related to Separating Lines, another gap-based continuation setup — the key difference is that Separating Lines is defined by two candles opening at the same level in opposite colors, while Side-by-Side White Lines requires two same-colored bullish candles after a gap. It's also worth distinguishing from a simple gap-and-go move, where a single strong candle after the gap is enough to suggest continuation — this pattern specifically requires two comparable candles holding the level, not just one.
Trading the Pattern
Entry
Most traders wait for a close above the high of the side-by-side formation before entering, treating the two matching candles as the setup and the subsequent breakout as the trigger.
Stop-Loss
A stop below the low of the side-by-side candles is standard; a more conservative option places the stop below the gap itself, since a full gap-fill would undercut the pattern's premise.
Profit Targets
Project the size of the gap upward from the breakout point as a baseline, and use nearby resistance or prior highs for a more specific target.
Because the setup depends on a gap holding, position sizing should account for gap risk — a surprising news event can fill or reverse a gap regardless of how clean the candle pattern looks.
Confirmation
The two matching candles are themselves a form of confirmation that the gap is being defended, but the more traditional trigger is a subsequent close above the high of the formation. Until that break happens, the pattern is better thought of as a support test in progress than a completed signal — a third candle that starts to slip below the second candle's low, even without fully closing the gap, is a sign the setup may be weakening.
Combining With Indicators
The pattern is more convincing when price stays well above key moving averages throughout the formation and when RSI holds above the 50 level rather than fading toward neutral or bearish territory. Steady or increasing volume across the two side-by-side candles is a useful secondary sign of genuine accumulation rather than thin, low-conviction trading, and a MACD line that stays above its signal line through the formation supports the idea that momentum hasn't actually turned despite the pause.
Where It's Most Meaningful
Because the pattern depends on identifying a genuine, non-overlapping gap, it's most reliably evaluated on daily charts, where a gap reflects an overnight shift in supply and demand rather than an artifact of a compressed intraday timeframe. It also tends to carry more weight in liquid, widely-held stocks — a gap that two separate sessions of real buying defend is a more meaningful signal than a similar-looking gap in a thinly traded name where a handful of trades can move the price. It's also more meaningful when the preceding uptrend has already established some credibility, since the pattern is fundamentally a test of whether recent gains can hold rather than a signal that starts a new trend from nothing.
Common Mistakes
- Trading it without a real gap. If the second candle's range overlaps with the first candle's, there's no gap and the pattern doesn't apply.
- Ignoring size mismatches. Two bullish candles after a gap that are very different in size don't carry the same side-by-side implication as two closely matched candles.
- Panicking on a partial gap-fill. Minor pullback into the gap doesn't necessarily invalidate the setup — a full close of the gap is the more meaningful threshold.
- Trading it outside an uptrend. The same structure without a genuine prior uptrend doesn't carry continuation significance.
- Overweighting a single confirming candle. One strong bullish candle after a gap is a normal continuation signal on its own, but it isn't the same as the specific two-candle side-by-side structure this pattern requires.
FAQs
What makes this pattern rare?
Both the specific gap requirement and the need for two similarly sized bullish candles at a matching level make this a narrower setup than more common continuation patterns.
What's the main risk with this pattern?
Gap-fill risk — all gaps carry some chance of being closed, which would undercut the pattern's bullish premise.
Do both side-by-side candles need to close at the same price?
No — they just need to open near the same level and be similar in size. A slightly higher close on the second candle is common and doesn't break the pattern.
How is this different from a normal gap-and-go continuation?
A generic gap-and-go can be confirmed by almost any follow-through. Side-by-Side White Lines specifically requires two matched bullish candles trading at the gapped-up level before continuation, which is a more specific and less frequent setup.
Does the pattern work the same way on lower timeframes?
The same structural rules can technically apply, but gaps on very short intraday timeframes are far more common and often reflect thin liquidity rather than genuine buying conviction, which makes the pattern less meaningful the shorter the timeframe gets.
Conclusion
Bullish Side-by-Side White Lines shows a gap being defended rather than faded: two similarly sized bullish candles holding at the higher level after the initial jump. Its main vulnerability is gap-fill risk, so treat the gap level as the key reference point for both invalidation and stop placement. It's a rarer setup than most continuation patterns, which is part of why a clean example is worth paying attention to. Because it depends on a gap staying open rather than simply pointing in a favorable direction, it rewards patience — waiting for an actual close above the formation, rather than assuming the second matching candle alone is enough, keeps the trade aligned with what the pattern is actually designed to confirm.