Bearish Shooting Star
Updated Aug 26, 2026
- Signal
- Bearish Reversal
- Reliability
- Moderate
- Rarity
- Common
- Confirmation
- Recommended
- Trend Position
- Uptrend Top
- Best Timeframes
- Daily+
On this page
A bearish shooting star is a single-candle pattern that can appear at the top of an uptrend. It forms when price opens near the session low, rallies well above that level intraday, and then gives back nearly all of the gain to close near where it opened. The long upper shadow shows that buyers pushed prices higher only to be turned back by sellers before the close. On its own it is a caution flag rather than a sell signal — most traders wait for the next session to confirm the reversal before acting.
Recognizing the Pattern
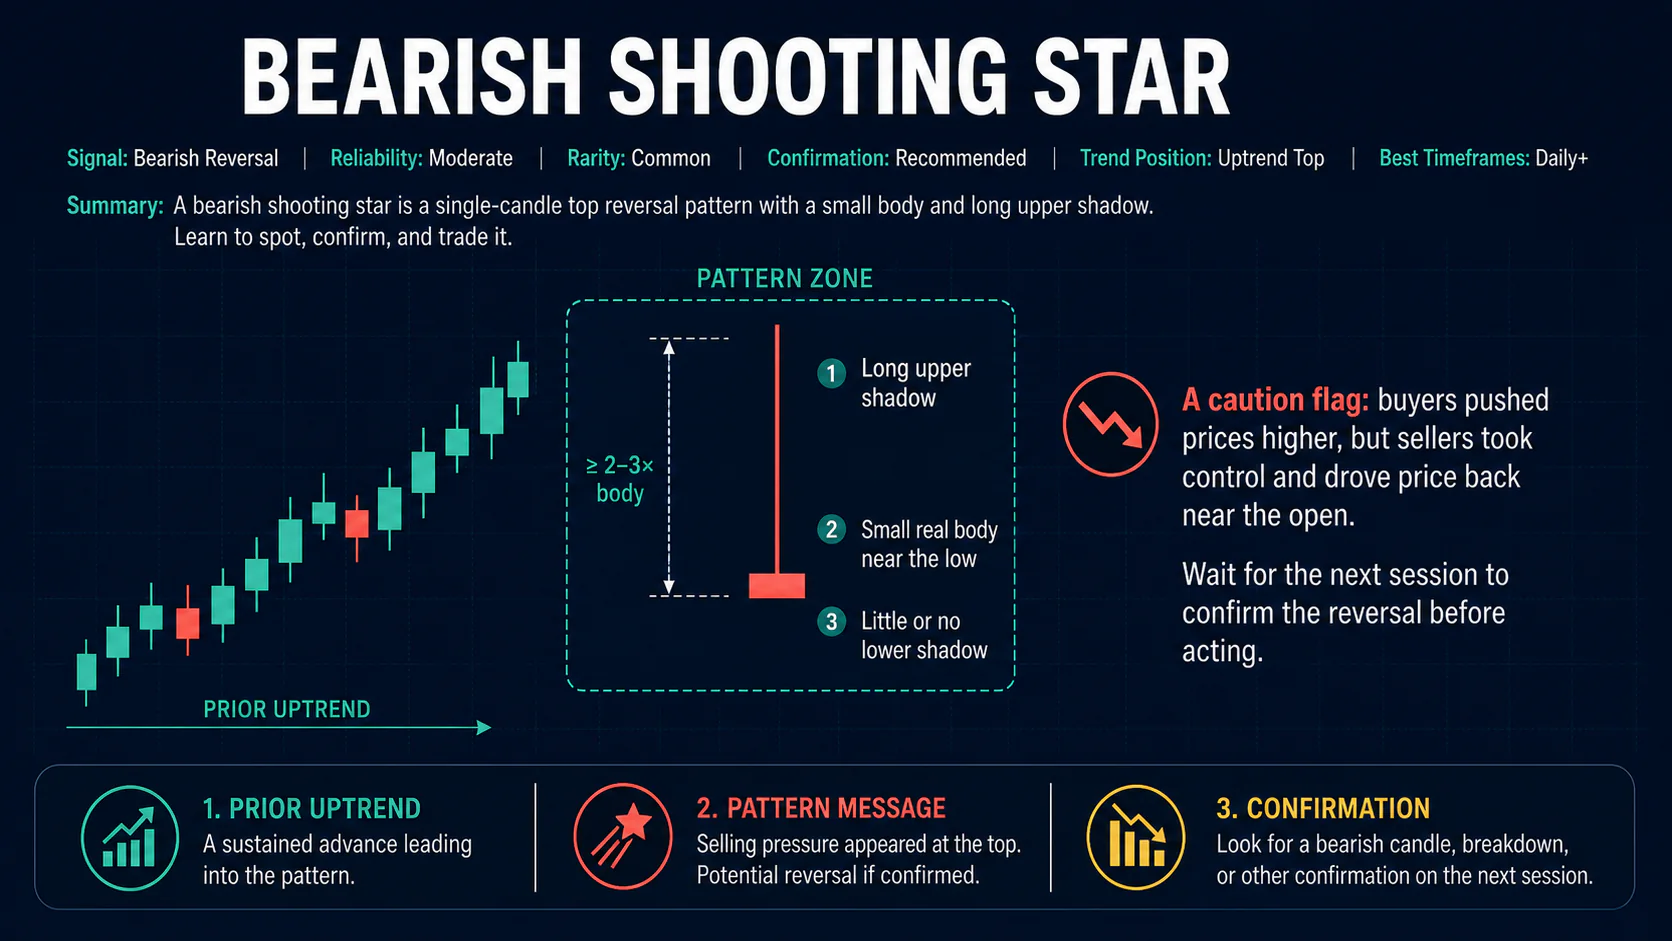
The shooting star is defined by four elements on a single candle:
- Small real body positioned near the low of the session's range, typically no more than about 25% of the total high-low range.
- Long upper shadow at least two to three times the length of the real body, showing price traded well above the eventual close before sellers took control.
- Little or no lower shadow, since the close holds near the low of the range.
- A prior uptrend — the pattern only carries reversal meaning after a sustained advance, ideally near a resistance level.
The real body can be either color; a black (down) body adds slightly more bearish weight but isn't required for a valid pattern. Above-average volume during the session strengthens the signal by suggesting real selling pressure met the rally, rather than a low-conviction drift back down.
The pattern shows up on any timeframe — intraday, daily, or weekly — though it's most often referenced on daily charts, where each candle reflects a full session's worth of buying and selling. A shooting star on a weekly chart following a multi-month advance generally carries more weight than the identical shape on a five-minute chart, simply because it reflects a longer, more meaningful tug-of-war between buyers and sellers.
Market Psychology
The pattern captures a single session in which buyers initially extend the uptrend, pushing price to a new intraday high, but sellers then take over and erase most or all of the advance by the close. That failure to hold the highs suggests the buying pressure driving the uptrend may be fading, and that sellers are now willing to act at these elevated prices. It's a warning sign of exhaustion rather than proof of a reversal — the next session's behavior determines whether the selling actually continues.
Variations
- Doji shooting star: the open and close are essentially equal, combining the upper-shadow rejection with the pure indecision of a doji. Many traders treat this as a somewhat stronger signal, since it adds explicit non-conviction to the price rejection.
- Red-bodied shooting star: the close finishes slightly below the open, adding modest bearish emphasis to the same structure.
- Shooting star at resistance: the identical shape forming exactly at a prior high, round number, or major moving average carries more weight, since the rejection coincides with an independent reason for sellers to show up.
Beyond these, treat "high volume" or "long shadow" versions as a matter of degree rather than distinct patterns — the more pronounced the upper shadow and the heavier the volume, the more convincing the rejection, but there's no fixed cutoff that turns a shooting star into something else.
Trading the Shooting Star
Entry: Most traders wait for the following session to confirm the reversal — for example, a close below the shooting star's low — rather than shorting immediately at the pattern's close. Setups that form at a known resistance level, or align with other bearish signals, offer a stronger case for acting.
Stop-loss: A stop placed above the shooting star's high is the standard approach, since a move back above that level negates the rejection the pattern represents.
Targets: Reasonable objectives include the next support level below the pattern, or a downside projection roughly equal to the length of the upper shadow measured from the pattern's low. Because reversals often stall at nearby support, it makes sense to plan on taking at least partial profit there rather than assuming an extended decline.
Confirmation
Because a single candle can mislead, confirmation matters. The strongest confirmation is a subsequent session that gaps down or closes decisively below the shooting star's low, ideally on noticeably higher volume. Continued weakness over the following sessions, or a break of nearby support, adds further conviction. Skipping confirmation and shorting purely on the shape of one candle is one of the more common ways this pattern produces losing trades.
Combining with Technical Indicators
A shooting star carries more weight when it lines up with other evidence of an overbought or exhausted uptrend: RSI above 70, a bearish MACD divergence building into the pattern, or an overbought stochastic reading. Confluence with an established resistance level, a round number, or a major moving average adds further support. None of these guarantee the reversal plays out, but multiple aligned signals make a setup more selective than the raw candle shape alone.
Common Mistakes
- Trading it without a real uptrend — in a sideways or declining market the same shape carries little reversal significance.
- Accepting a body that's too large, or an upper shadow too short to represent genuine rejection.
- Skipping confirmation and entering on the shooting star's close alone.
- Ignoring volume, which helps separate a meaningful rejection from routine noise.
- Setting downside targets that ignore nearby support levels likely to slow the decline.
- Treating every occurrence as tradeable rather than reserving the pattern for higher-quality setups at meaningful resistance.
Where It Fits in a Trading Plan
A shooting star works best as one piece of a broader read on a chart, not as a standalone trigger. Traders who use it successfully tend to map out support and resistance ahead of time, check where momentum indicators already stand, and give real weight only to a shooting star that lines up with that existing picture. Because any single candlestick pattern can fail, it also makes sense to risk only a small, predefined portion of a trading account on each setup, sized so a stop-out at the pattern's invalidation point is a planned, minor loss rather than a major one. Reviewing past shooting star trades — which worked, which didn't, and why — is a practical way to calibrate how much weight the pattern deserves for a given stock or market.
FAQs
Is a shooting star always bearish?
Only in context. The same candle shape appearing during a downtrend or sideways range doesn't carry the same implication — it needs to follow a genuine uptrend to be read as a shooting star.
What's the difference between a shooting star and an inverted hammer?
They look identical — small body near the low, long upper shadow — but their position in the trend differs. A shooting star appears after an uptrend and warns of a top; the same shape after a downtrend is called an inverted hammer and is read as a possible bottom.
Does a shooting star need confirmation before trading?
Most traders treat confirmation as necessary rather than optional. A single candle can easily fail, so waiting for the next session to close lower adds meaningful protection.
How does a shooting star differ from a hanging man?
Both are single-candle warnings at the top of an uptrend, but the shadow sits on the opposite end: a shooting star has a long upper shadow with the body near the low, while a hanging man has a long lower shadow with the body near the high.
Where should a stop-loss go?
Above the high of the shooting star candle. A move back above that level means buyers reclaimed the territory the pattern rejected, invalidating the bearish read.
Does the shooting star work the same way on every timeframe?
The shape can appear anywhere, but it tends to carry more weight on daily or weekly charts, where each candle reflects a fuller session of trading, than on very short intraday charts where randomness plays a bigger role.
Conclusion
The bearish shooting star is a straightforward, fairly common warning that an uptrend may be running out of steam: a rally that fails to hold by the close. It works best after an extended advance, at or near resistance, and with confirmation from the following session before acting. Treat it as one input among several rather than a standalone sell signal, and size positions with the understanding that, like any single-candle pattern, it can fail.