Bearish Separating Lines
Updated Aug 26, 2026
- Signal
- Bearish Continuation
- Reliability
- Moderate
- Rarity
- Common
- Confirmation
- Recommended
- Trend Position
- Mid-Trend
On this page
Bearish separating lines are a two-candle continuation pattern that appears in a downtrend. A white candle creates a brief bounce, then the next candle opens at the exact same price and reverses lower, closing well below that shared open. The identical opens make clear the bounce has been rejected outright, and the downtrend is expected to resume.
Recognizing the Pattern
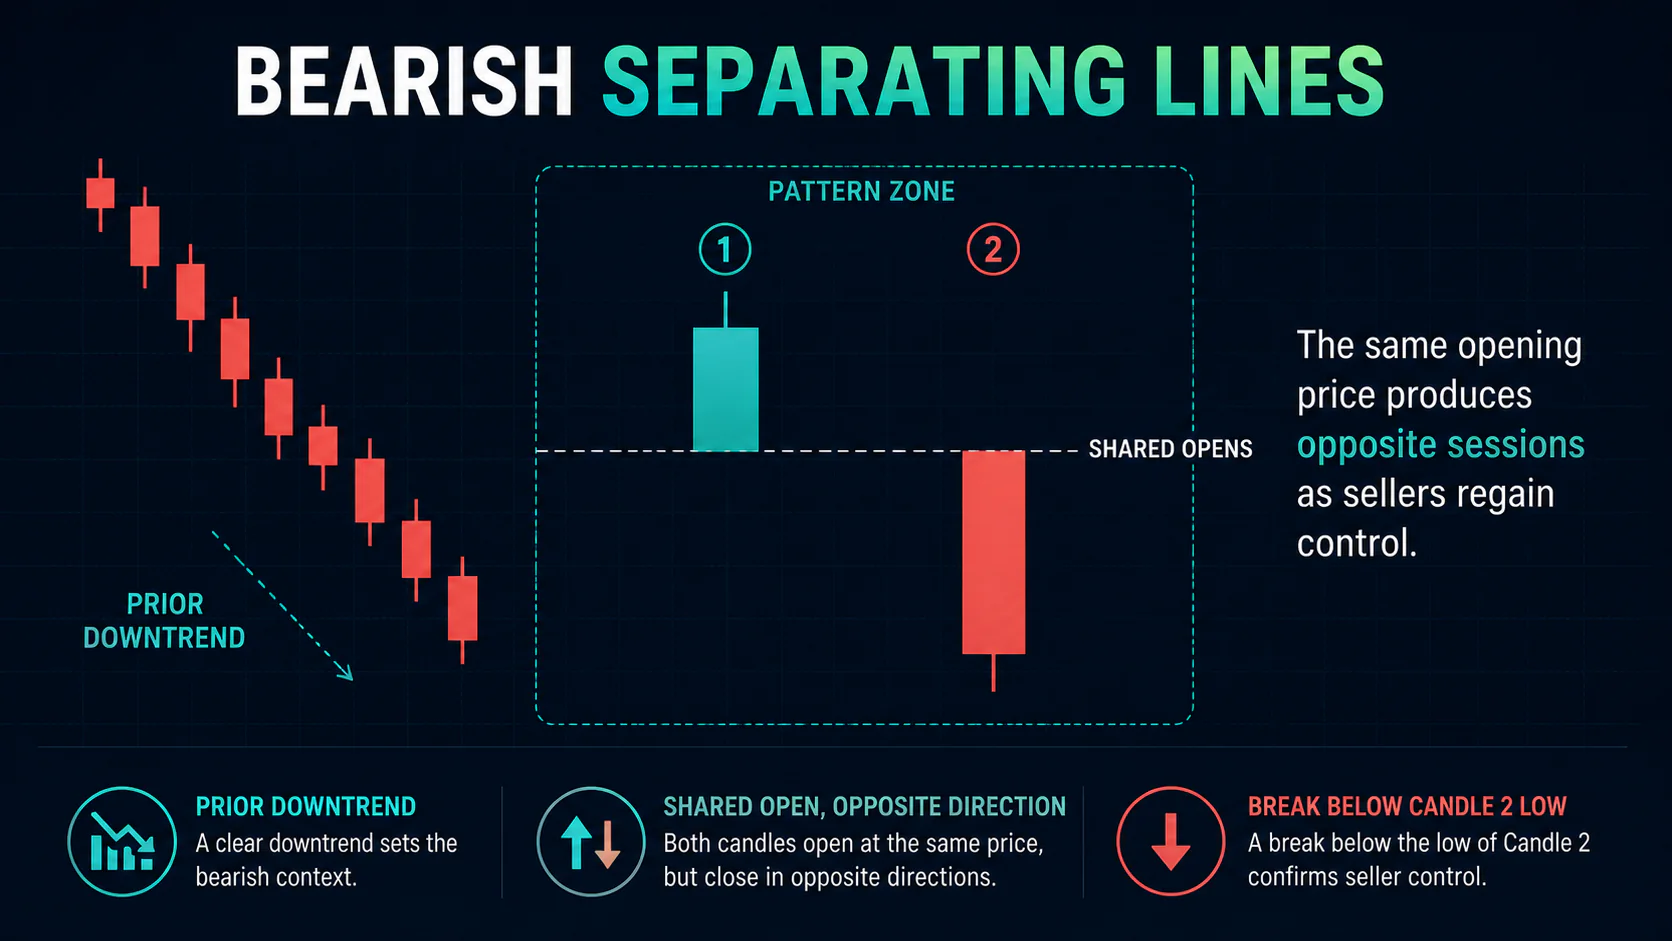
First candle: a white (or green) candle appearing within an established downtrend, showing a temporary bounce or pause in selling.
Second candle: a black (or red) candle that opens at essentially the same price as the first candle's open, then sells off to close meaningfully lower.
The defining feature is the shared opening price - both candles start from the same level but diverge in opposite directions, which is where the "separating lines" name comes from. Both candles should have reasonably sized real bodies; doji-like candles with little conviction weaken the pattern's message. The setup only carries continuation significance within a clear, pre-existing downtrend.
Market Psychology
The first candle's bounce reflects short covering, oversold buying, or simple hope that the decline is ending, and it can tempt bullish traders into believing a reversal is underway. The second candle's open at the identical price immediately erases that impression: the exact same level that showed strength a session earlier now shows renewed selling, and the close well below that open confirms sellers regained control quickly and decisively. Traders caught leaning bullish from the first candle are often forced to exit as the second candle develops, adding to the downward pressure.
Variations
A larger first (bullish) candle sets up a more convincing pattern, since it creates a more visible bull trap for the second candle to reject. Some versions see the second candle actually gap slightly lower before continuing to sell off, adding an extra layer of weakness beyond the basic shared-open requirement. The core requirement - matching opens and opposite-colored bodies - stays the same across these variants; what changes is simply how emphatic the rejection looks.
Trading the Pattern
Entry: a short position can be entered at the close of the second candle once the pattern is confirmed, particularly if that candle shows increased volume.
Stop-loss: place stops above the high of the first (bullish) candle; a sustained move back above the shared opening level would undercut the bearish read.
Targets: project the combined range of the two candles downward from the pattern's low, and look to the next significant support level or the lower edge of the established downtrend channel for a more ambitious target.
Confirmation
A close in the lower portion of the second candle's range adds weight to the pattern, as does a following session that extends the decline rather than reclaiming the shared opening level. Higher volume on the second (bearish) candle than the first supports the pattern, since it points to renewed institutional selling rather than thin, low-conviction trade.
Combining with Indicators
RSI staying below its midline through the pattern, or the pattern forming beneath a key moving average, both provide useful confluence. For a related pattern that also hinges on matching price levels, see bearish meeting lines.
Common Mistakes
Accepting opens that differ by a meaningful amount as "close enough" undermines the pattern, since the shared opening price is its defining feature. Trading the setup without a genuine preceding downtrend, ignoring the volume relationship between the two candles, or entering before the second candle closes are the other common mistakes.
FAQs
What makes separating lines different from an ordinary reversal candle?
The identical opening price between the two candles is the key: it shows the market returning to the exact level of the prior session's strength and immediately rejecting it, which is a more specific signal than a simple down day.
Is this a continuation or reversal pattern?
Continuation. It confirms an existing downtrend is likely to resume after a brief bullish pause, not that the trend is changing direction.
Does volume matter for this pattern?
Yes, qualitatively - stronger volume on the second, bearish candle adds confidence that the renewed selling has real conviction behind it.
How common is this pattern?
It appears fairly regularly in trending markets, since it only requires two candles sharing an open price and moving in opposite directions.
What invalidates a separating lines setup?
A second candle that fails to close meaningfully lower, or a subsequent session that pushes back above the shared opening level, both weaken or invalidate the bearish read.
Does the pattern work the same way in an uptrend?
The bullish version of this pattern (a black candle followed by a white candle sharing the same open) confirms uptrend continuation; the logic mirrors the bearish version but signals in the opposite direction.
Conclusion
Bearish separating lines give a clean, visual confirmation that a bounce inside a downtrend has failed at the exact level it started. The pattern is most useful as one piece of evidence supporting an existing downtrend thesis, backed by normal confirmation and risk management.